

Bitcoin (BTC) has rebounded from a confluence of minor support areas and is showing signs of a potential short-term trend reversal.
Bitcoin has been trading above an ascending support line since Jan 24. The line has been validated four times (green icons), most recently on March 7. Furthermore, the price has broken down below it twice before creating a long lower wick and reclaiming the support.
Support lines get weaker each time they are touched. Therefore, it seems possible that BTC could soon break down from this line.
In addition to this, technical indicators are bearish, as both the RSI and MACD are decreasing. Furthermore, the MACD is negative and the RSI is below 50, both of which are considered signs of a bearish trend.

Short-term support
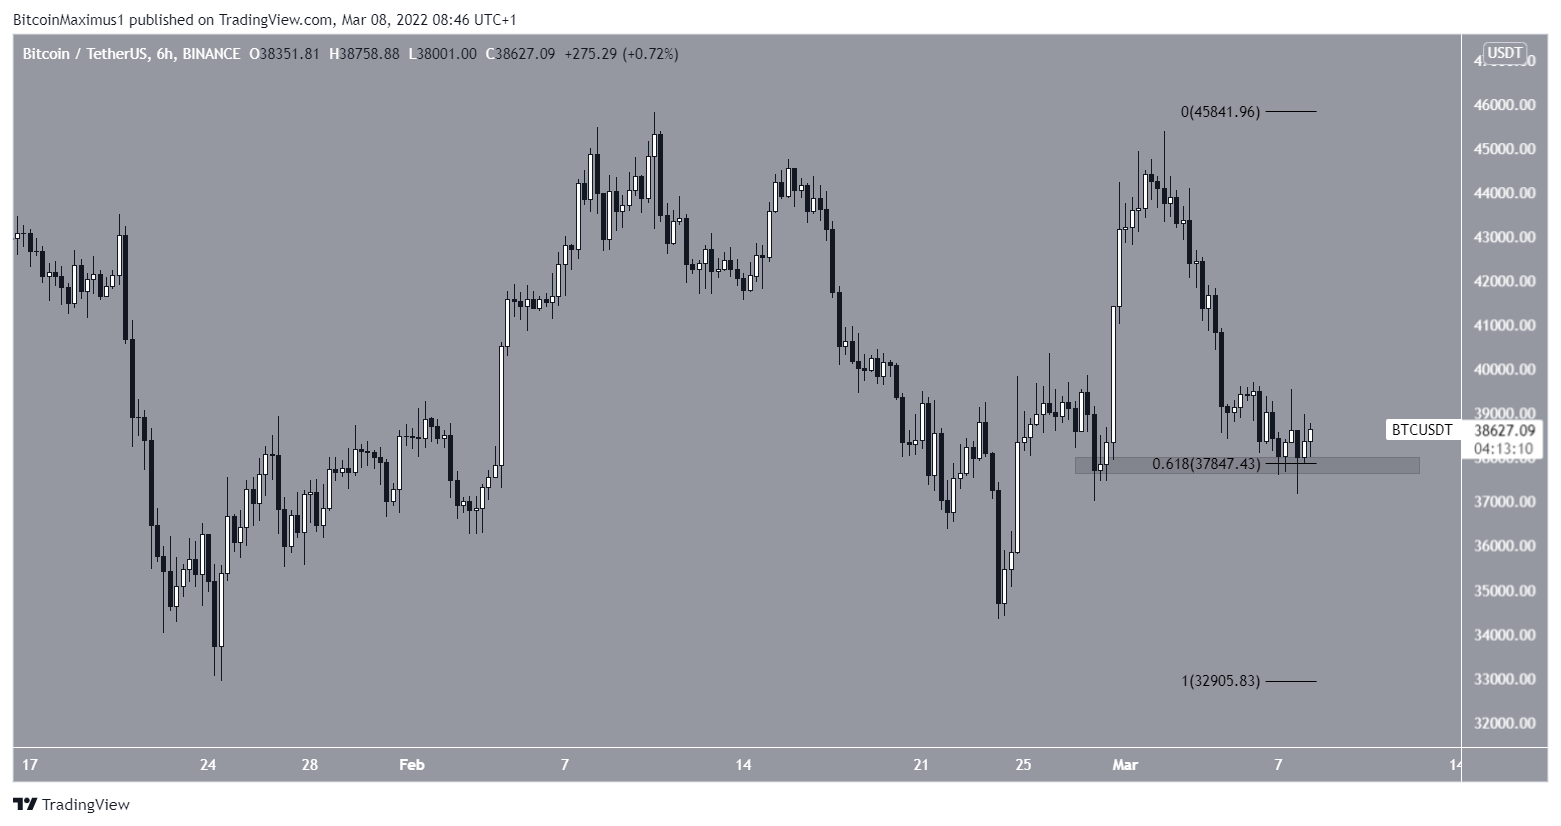
Despite the relative bearishness from the daily chart, lower time frames are considerably more bullish.
The six-hour chart shows that BTC has twice bounced at the 0.618 Fib retracement support level near $37,800.
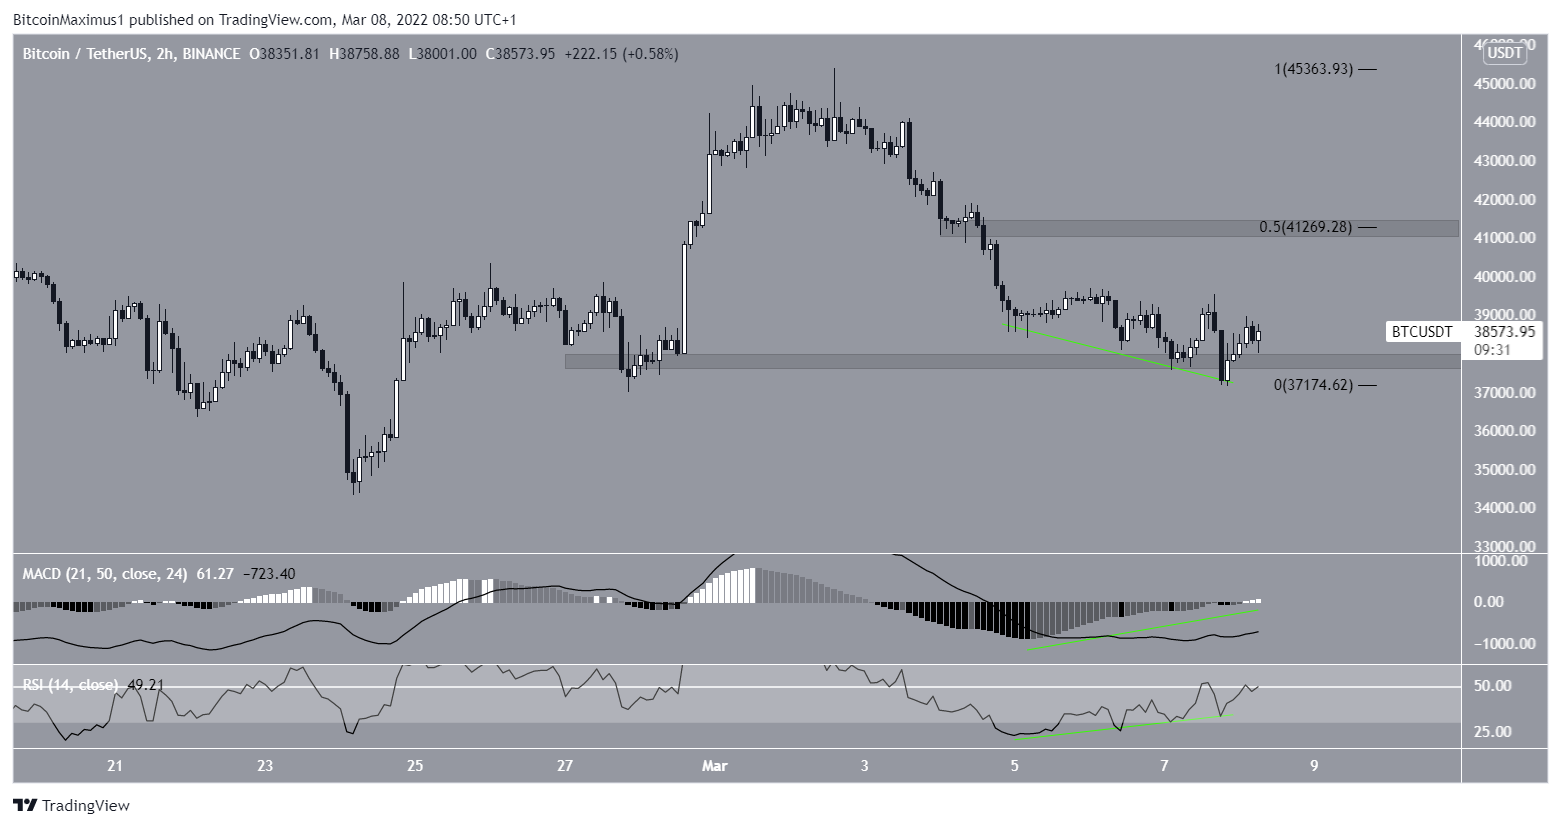
In addition to this, the two-hour chart suggests an imminent rebound.
The reason for this is the pronounced bullish divergences that have developed in both the RSI and MACD (green lines). Such divergences often precede bullish trend reversals.
If a reversal occurs, the closest resistance area would be found at $41,250. This is the 0.5 Fib retracement resistance level and a horizontal resistance area.
BTC wave count analysis
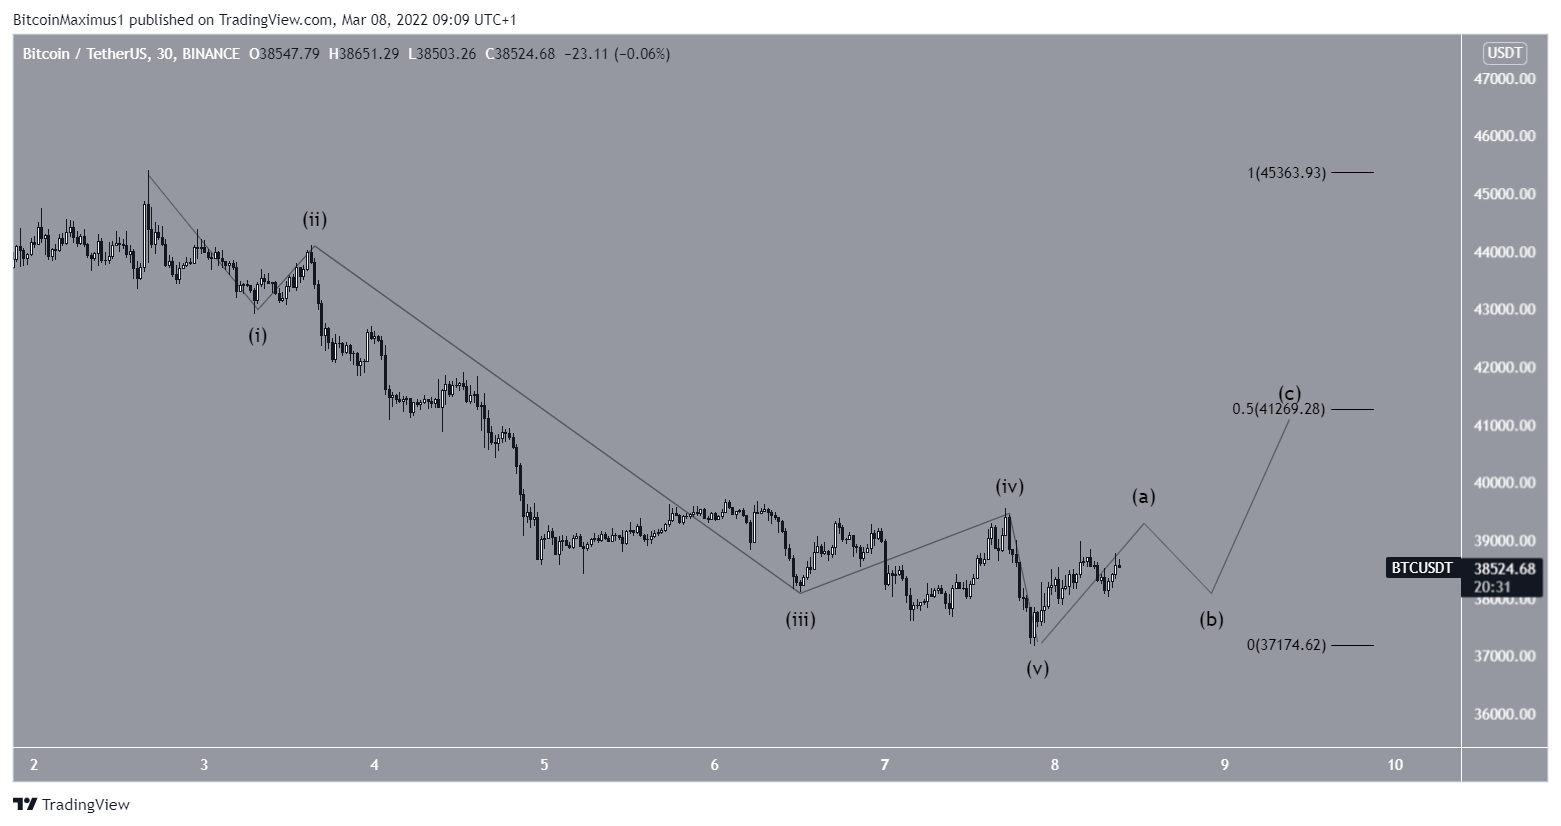
The long-term wave count remains unclear. However, the short-term count suggests that BTC is primed to bounce back to the $41,000 level
The reason for this is that BTC seems to have completed a five-wave downward move measuring from March 3.
What follows is normally a corrective structure, which could take BTC to the proposed $41,250 resistance area.
Following the completed pattern, the downward trend could likely resume.
For BeInCrypto’s previous Bitcoin (BTC) analysis, click here
Trusted
Disclaimer
In line with the Trust Project guidelines, this price analysis article is for informational purposes only and should not be considered financial or investment advice. BeInCrypto is committed to accurate, unbiased reporting, but market conditions are subject to change without notice. Always conduct your own research and consult with a professional before making any financial decisions. Please note that our Terms and Conditions, Privacy Policy, and Disclaimers have been updated.
