

Bitcoin (BTC) is attempting to find support and create a higher low after a breakout from a short-term resistance line.
BTC has been decreasing underneath a descending resistance line since March 28. So far, this downward movement has led to a low of $17,622 on June 18. The price has been increasing since.
The main resistance area is at $23,275, created by a confluence of resistance levels. It is a:
- Horizontal resistance area
- 0.382 Fib retracement resistance level
- Coincides with the descending resistance line
The RSI has increased above 30, moving outside its oversold territory. This means that the trend is turning bullish, and could suggest that an increase towards the resistance area would be likely. If the price gets there, this would also take the RSI to its descending resistance line that has also been in place since March 28.
So, a breakout from these levels would confirm that the trend is bullish.

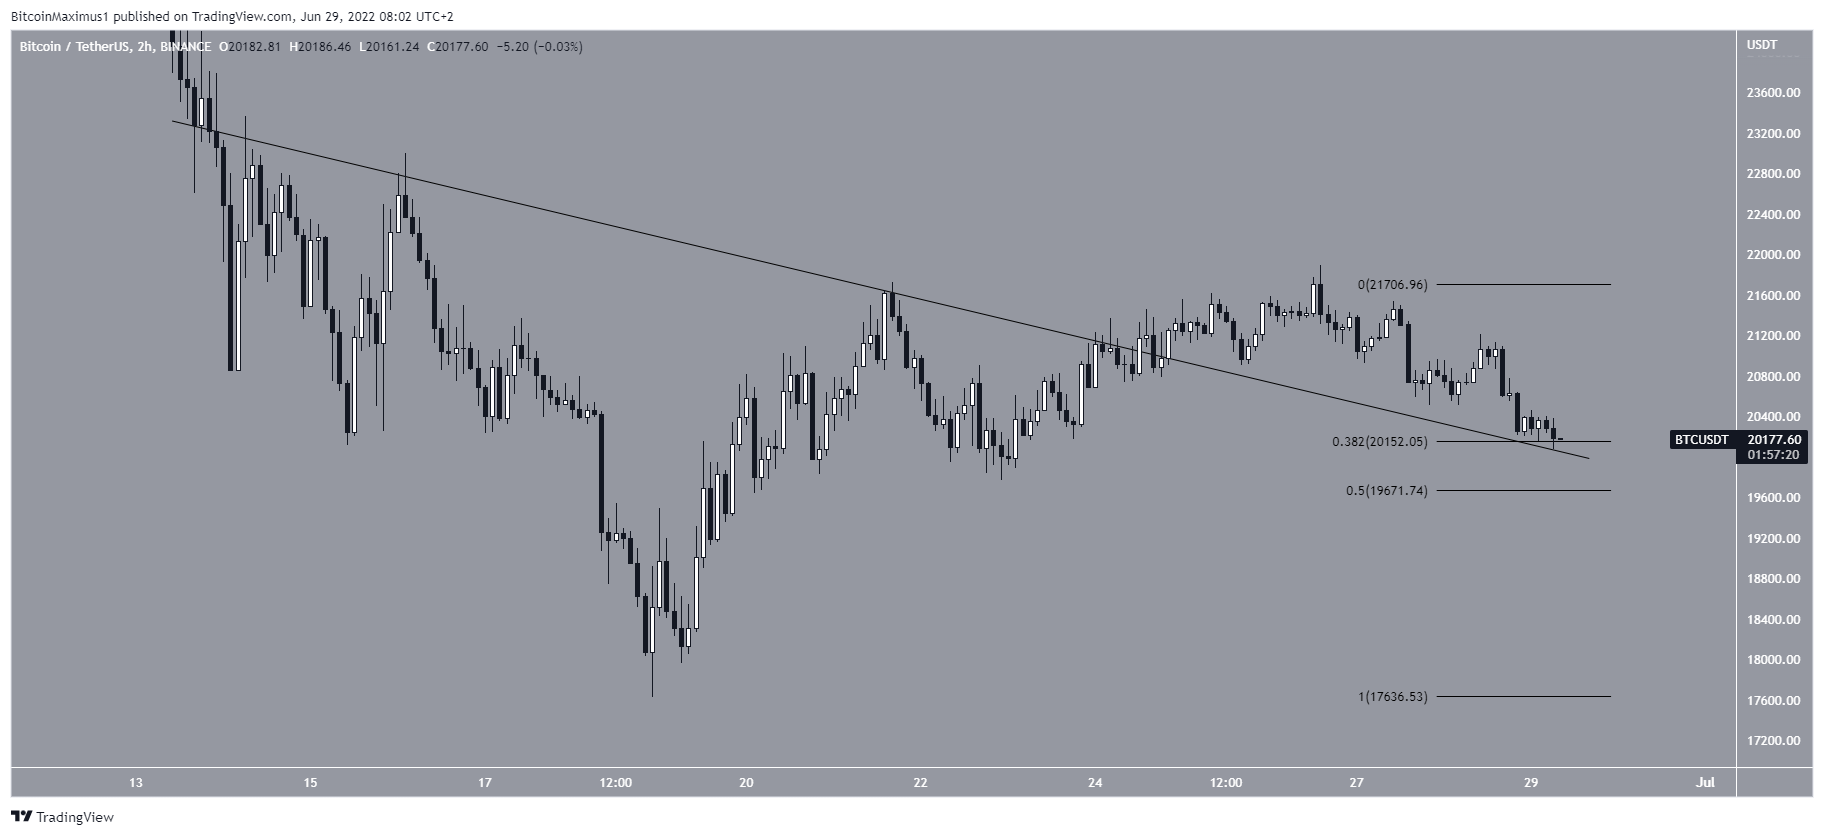
Short-term movement
The two-hour chart shows that the price has broken out from a descending resistance line and is currently attempting to validate it as support.
Besides the line, which is now expected to provide support, the price is trading above the 0.382 Fib retracement support level at $20,150. So, these two levels could initiate a bounce and upward movement towards the aforementioned resistance line
If the price falls further, the next support would be at the 0.5 Fib retracement level at $19,670.
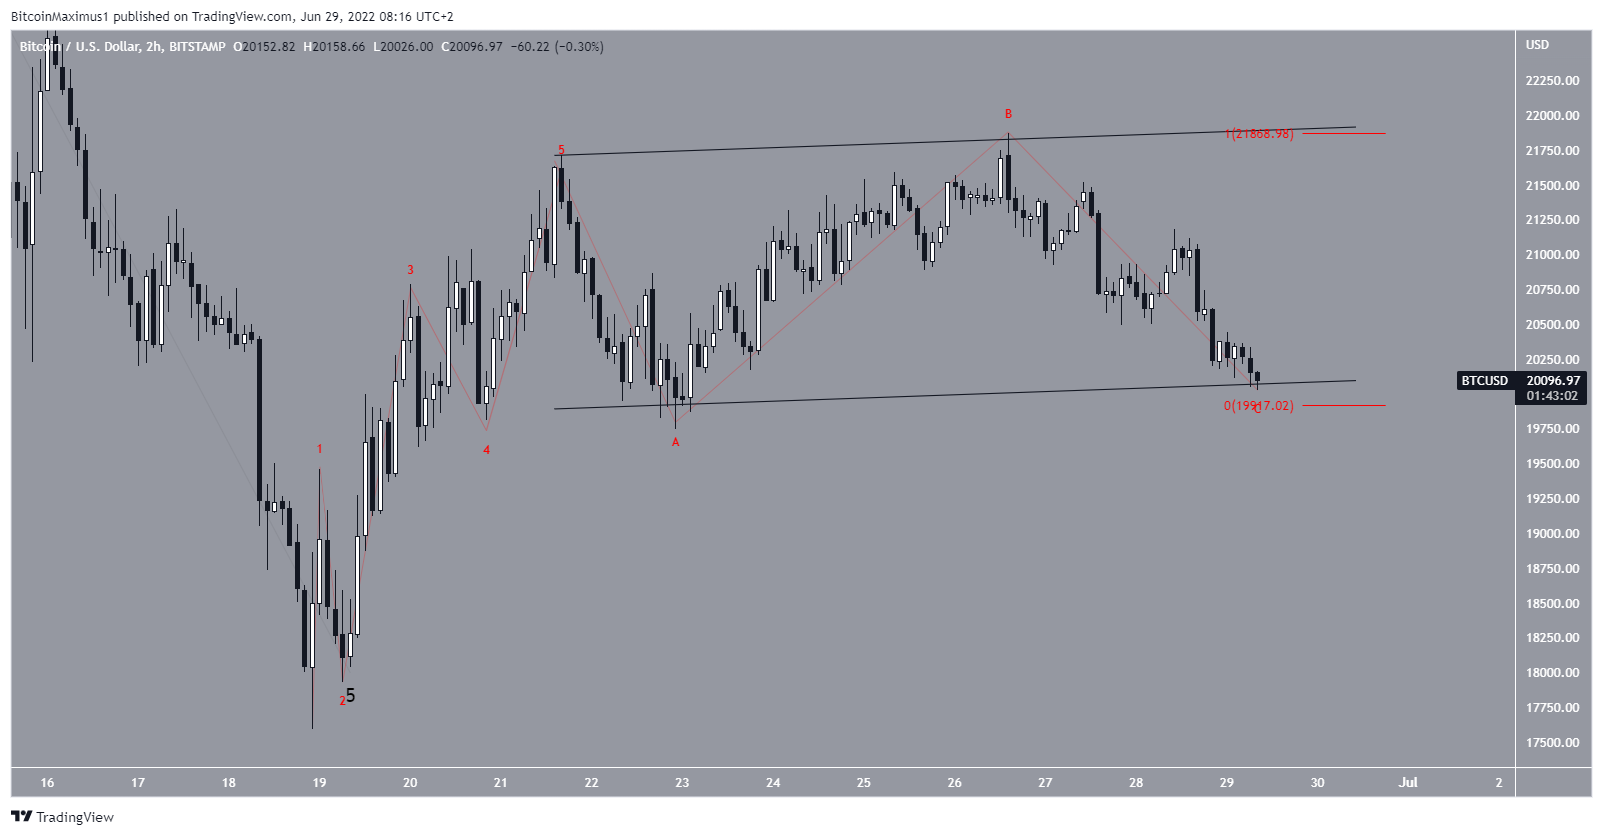
BTC wave count analysis
There are still several possibilities for the long-term wave count. On the other hand, the shorter-term count is clearer.
The most likely count indicates that the price has completed a five-wave upward movement (red), and potentially an A-B-C corrective structure.
If the structure is a running flat correction, that it is likely already complete, since waves A:C have had a 1:1 ratio and the entire structure is contained inside an ascending parallel channel.
If the structure becomes an irregular flat instead, the price could fall towards the next support at $19,670.
For Be[in]Crypto’s previous bitcoin (BTC) analysis, click here
Trusted
Disclaimer
In line with the Trust Project guidelines, this price analysis article is for informational purposes only and should not be considered financial or investment advice. BeInCrypto is committed to accurate, unbiased reporting, but market conditions are subject to change without notice. Always conduct your own research and consult with a professional before making any financial decisions. Please note that our Terms and Conditions, Privacy Policy, and Disclaimers have been updated.
