

The upward movement for bitcoin came to a temporary halt on Oct 12, causing a sharp fall to the $55,000 level. BTC has bounced back some since but is rapidly approaching the top of its upward move if it hasn’t done so already.
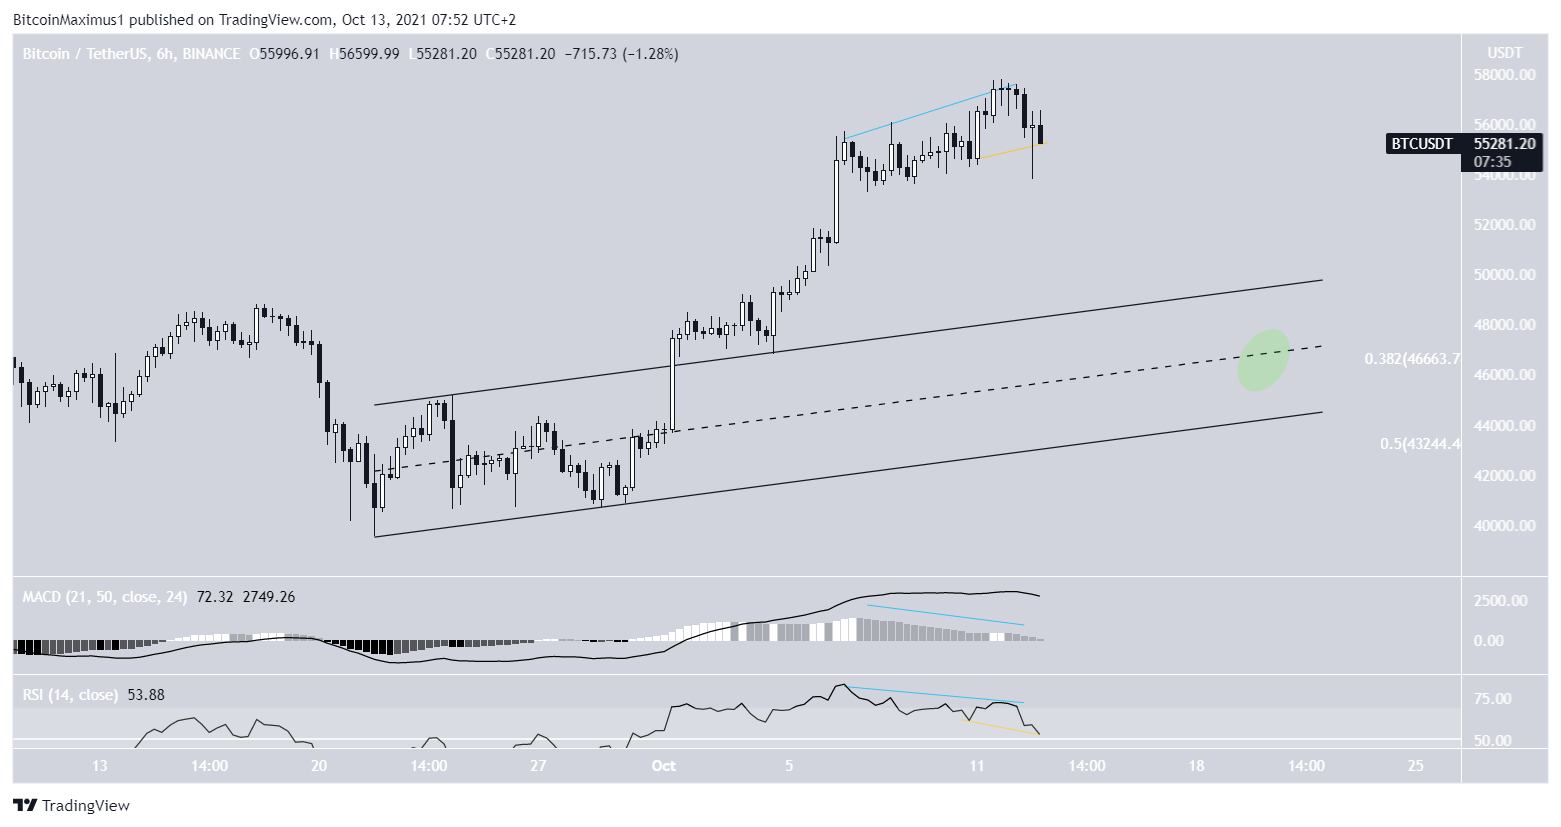
On Oct 12, BTC reached a high of $57,839, going well into the $57,200 resistance area.
However, it was rejected (red icon) and decreased considerably. The rejection is a sign that the price was not able to break out above the $57,200 resistance area. This is the final resistance prior to a new all-time high price.
Despite the drop, technical indicators are still bullish.
The MACD, which is created by a combination of short and long-term moving averages (MA) is positive and increasing. This means that the short-term trend is faster than the long-term trend.
However, the RSI, which is a momentum indicator, is showing some signs of weakness (red circle). It has just decreased below 70, which means that even though the trend is still bullish, it has shown the first signs of losing momentum and potentially turning bearish.
The closest support levels are found at $46,650 and $43,250. These are the 0.382 and 0.5 Fib retracement support levels (white) and are expected to support the price if it continues to fall back.

Potential pullback
The six-hour chart shows pronounced weaknesses. Both the RSI and MACD have generated bearish divergences (blue lines).
This occurrence indicates that the price increase was not accompanied by a similar increase in momentum. On the contrary, momentum was decreasing while the price was moving upwards. It remains to be seen if the RSI will generate a hidden bearish divergence (yellow line), which would invalidate the previous normal divergence.
If the downward movement continues, there is a further confluence of support at $46,650. Besides being the 0.382 Fib retracement support level, it’s the midline of the parallel channel from which BTC broke out previously (green circle).
Bitcoin wave count
The most likely wave count indicates that the ongoing decrease was the final portion of wave four, which was contained inside a parallel ascending channel.
In this case, the next upward move will be the final phase prior to a correction.
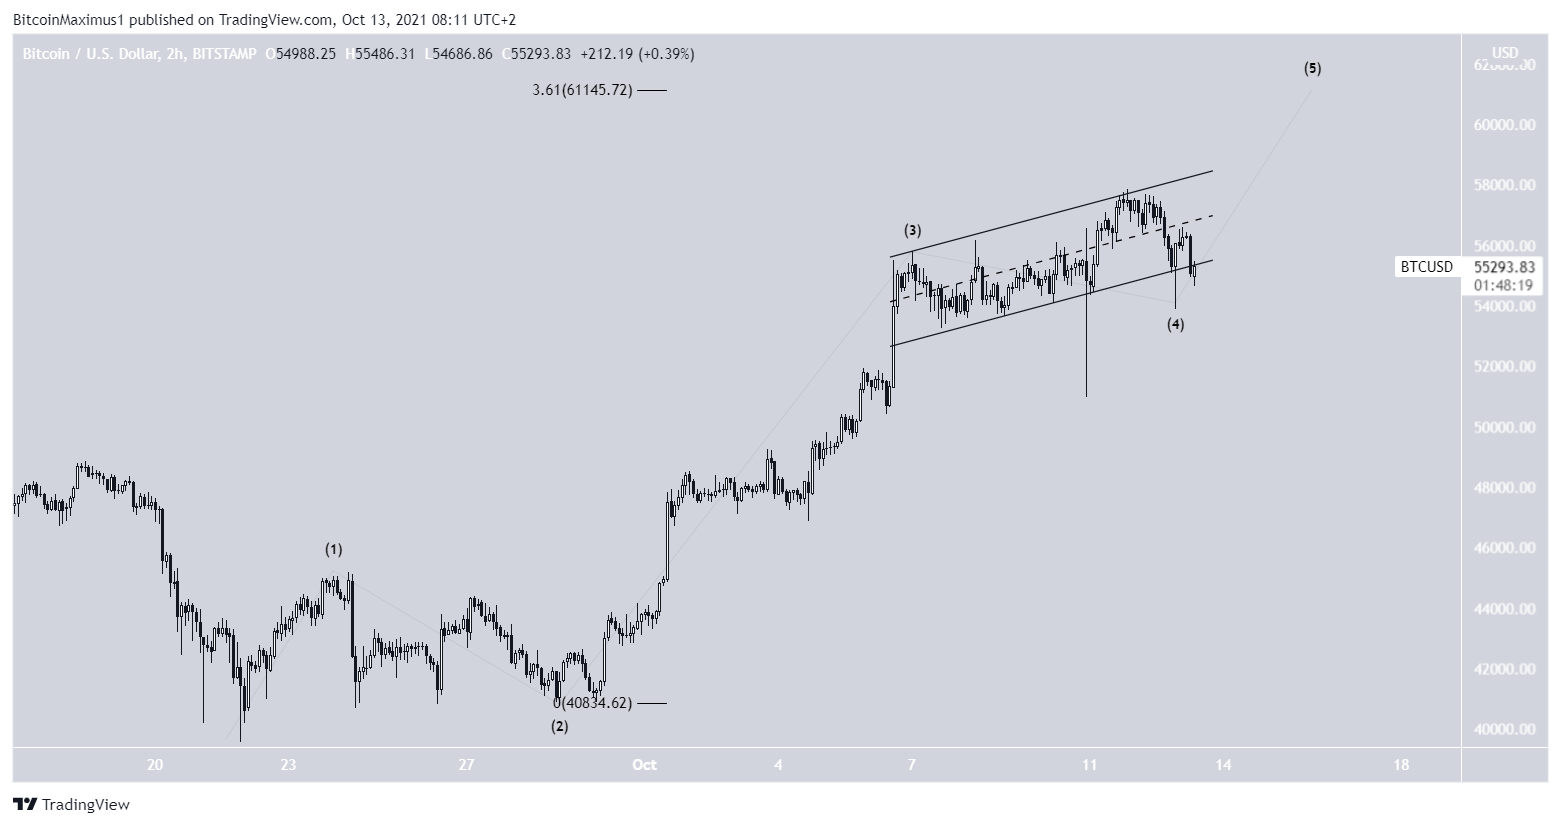
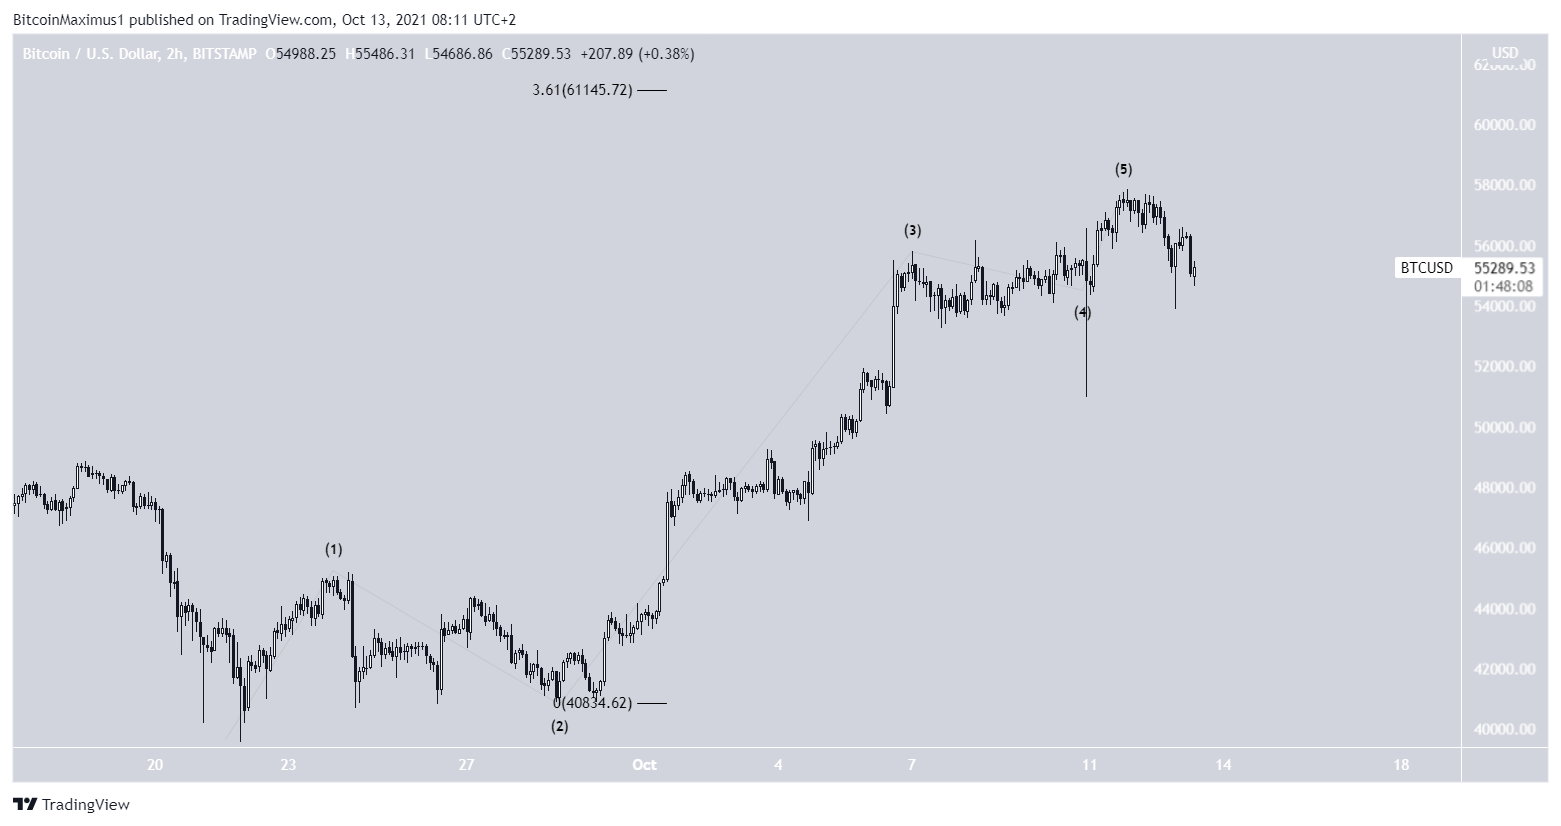
The second possibility is that BTC has reached a top and is now correcting. This is less likely due to the fact that the waves are not related to each other by any proportions because they all have very different lengths.
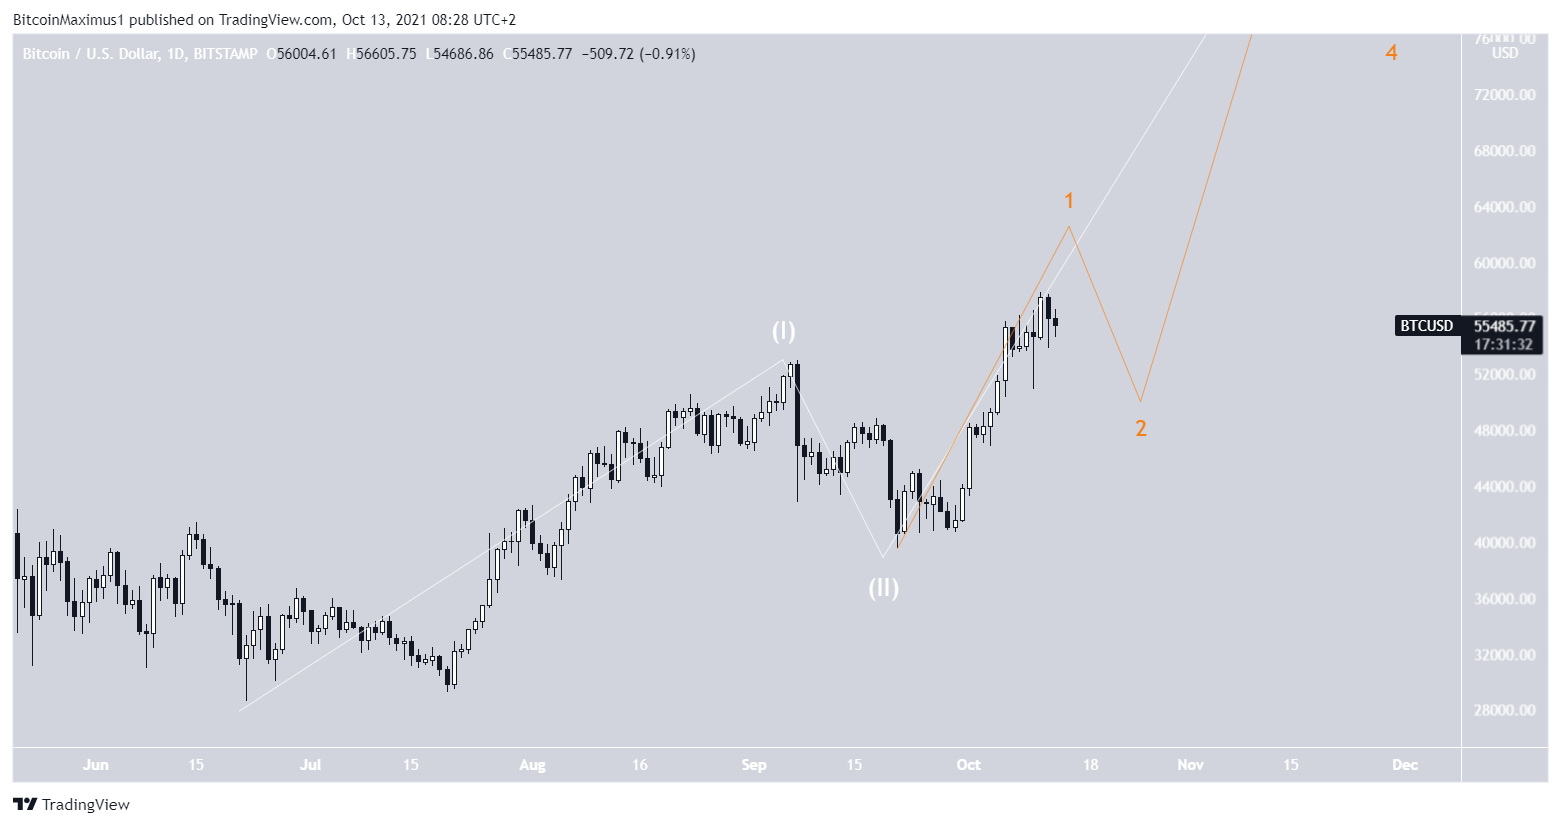
The long-term wave count indicates that BTC is in a 1-2/1-2 wave formation. This means that it could increase considerably after the correction is complete.
For BeInCrypto’s previous Bitcoin (BTC) analysis, click here.
Trusted
Disclaimer
In line with the Trust Project guidelines, this price analysis article is for informational purposes only and should not be considered financial or investment advice. BeInCrypto is committed to accurate, unbiased reporting, but market conditions are subject to change without notice. Always conduct your own research and consult with a professional before making any financial decisions. Please note that our Terms and Conditions, Privacy Policy, and Disclaimers have been updated.
