

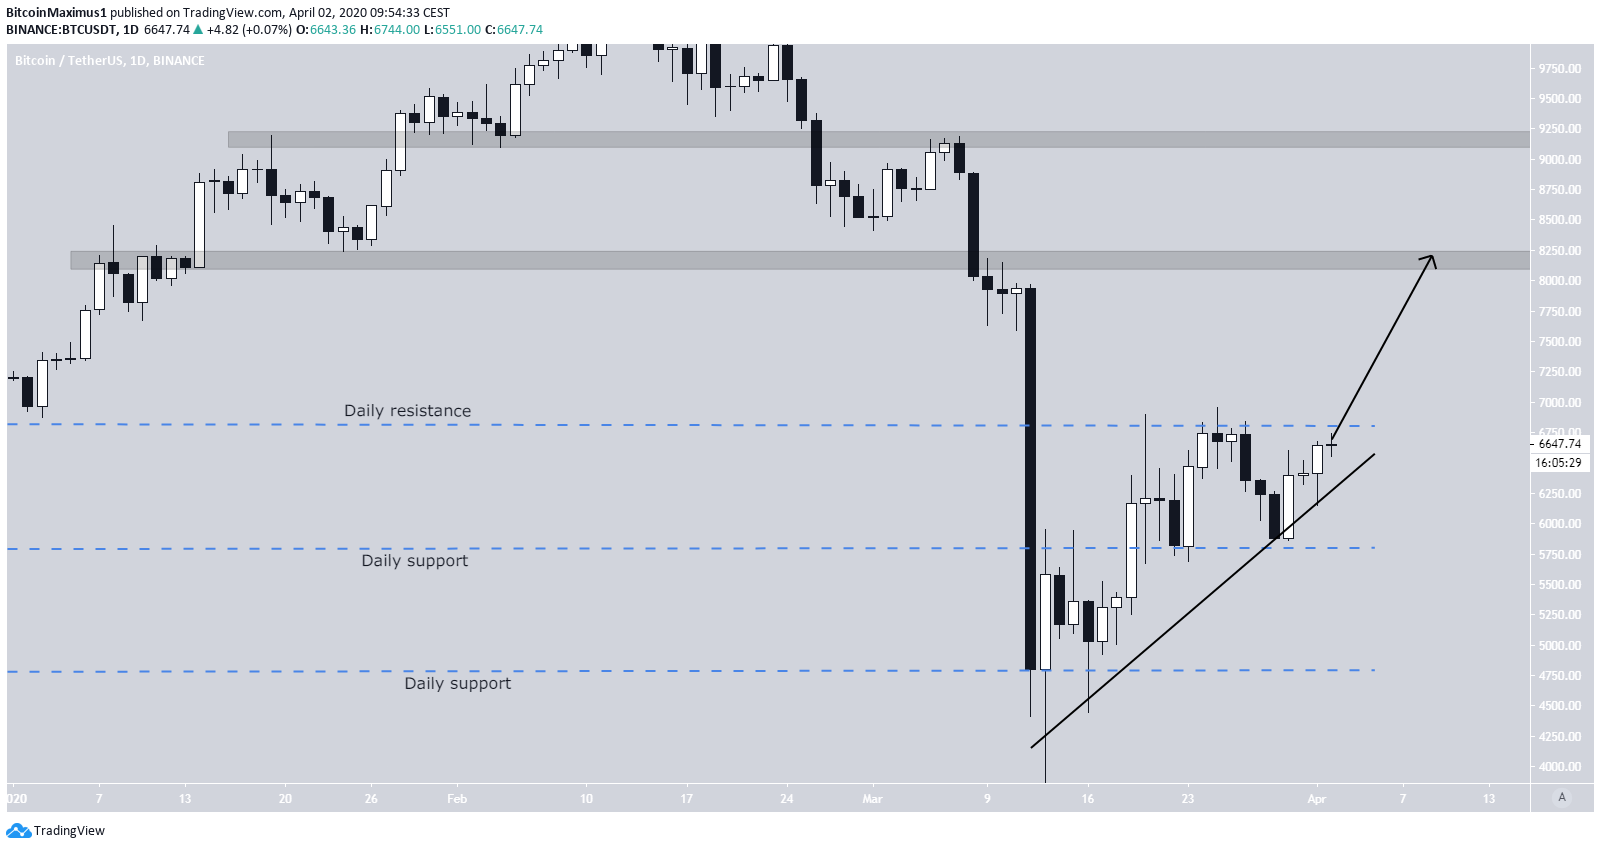
On April 1, the Bitcoin price initiated an upward move that caused it to break out above its descending resistance line and with it the symmetrical triangle it had been trading in since March 20.
Bitcoin Price Breakout
Last night, the Bitcoin price broke out from the possible symmetrical triangle it has been trading in since March 20. The breakout transpired after the price completed an A-B-C-D-E correction, even though the E wave failed to touch the ascending support line of the triangle. In addition, volume was significant — the highest on a bullish candlestick since March 23.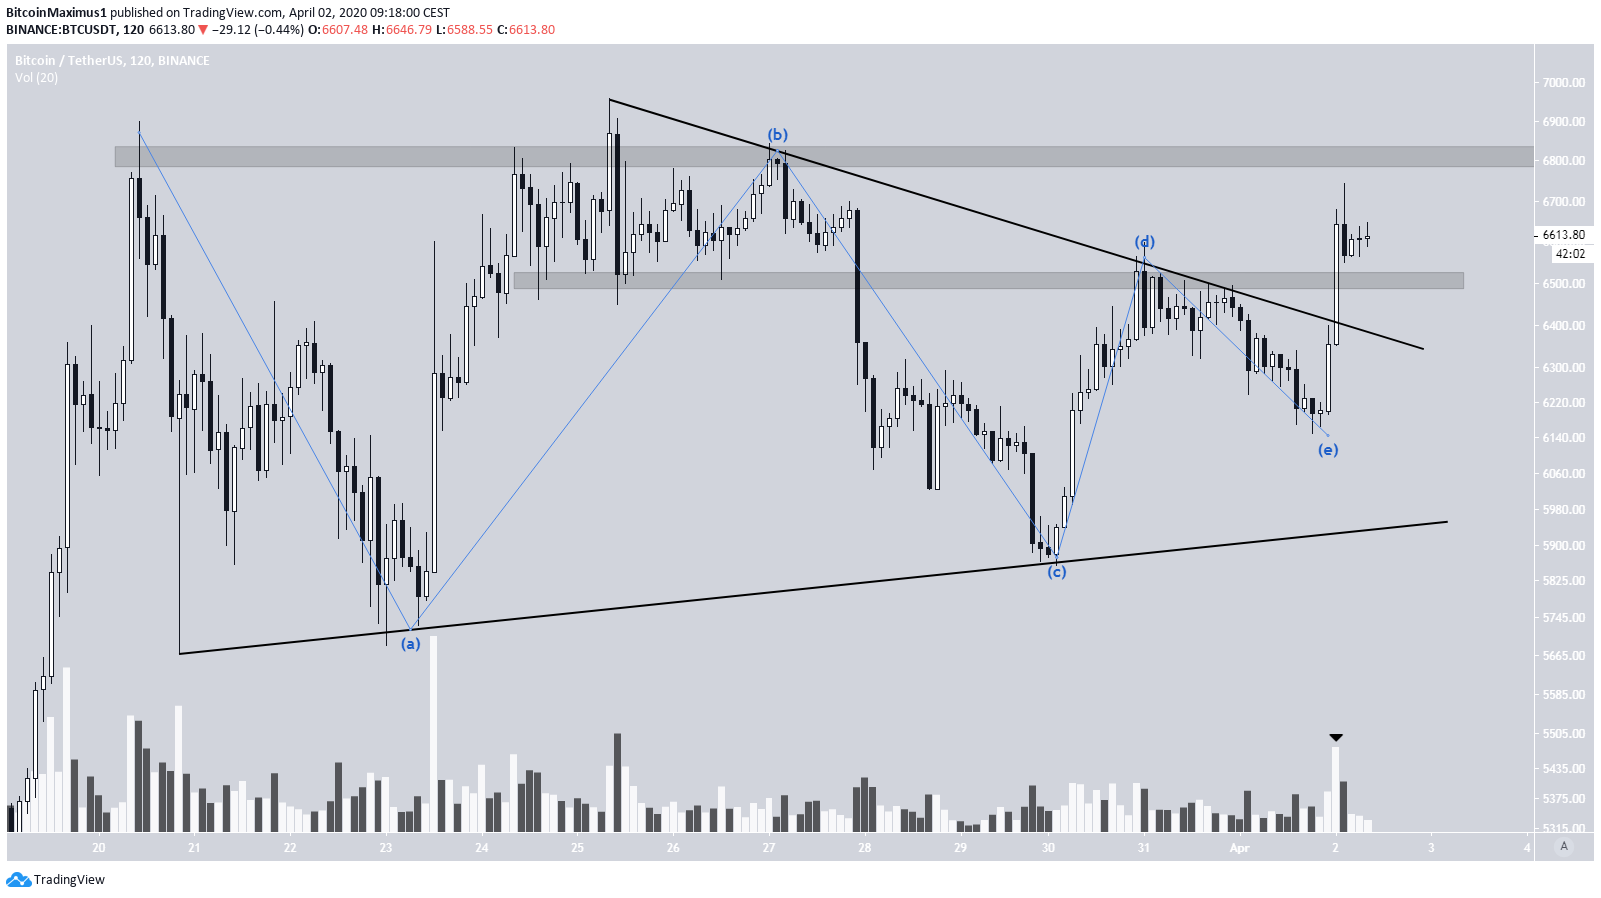
Ascending Support
A look at a longer-term chart reveals that the price has been following a longer-term ascending support line since reaching a bottom on March 13. On March 30, the price validated it for the fourth time and created a bullish engulfing candlestick. As for the resistance, the price could either be following a horizontal or a descending line, which creates either an ascending or symmetrical triangle. Whichever may be the case, due to the creation of four consecutive higher-lows and the lack of bearish divergence, the price is expected to break out above this resistance.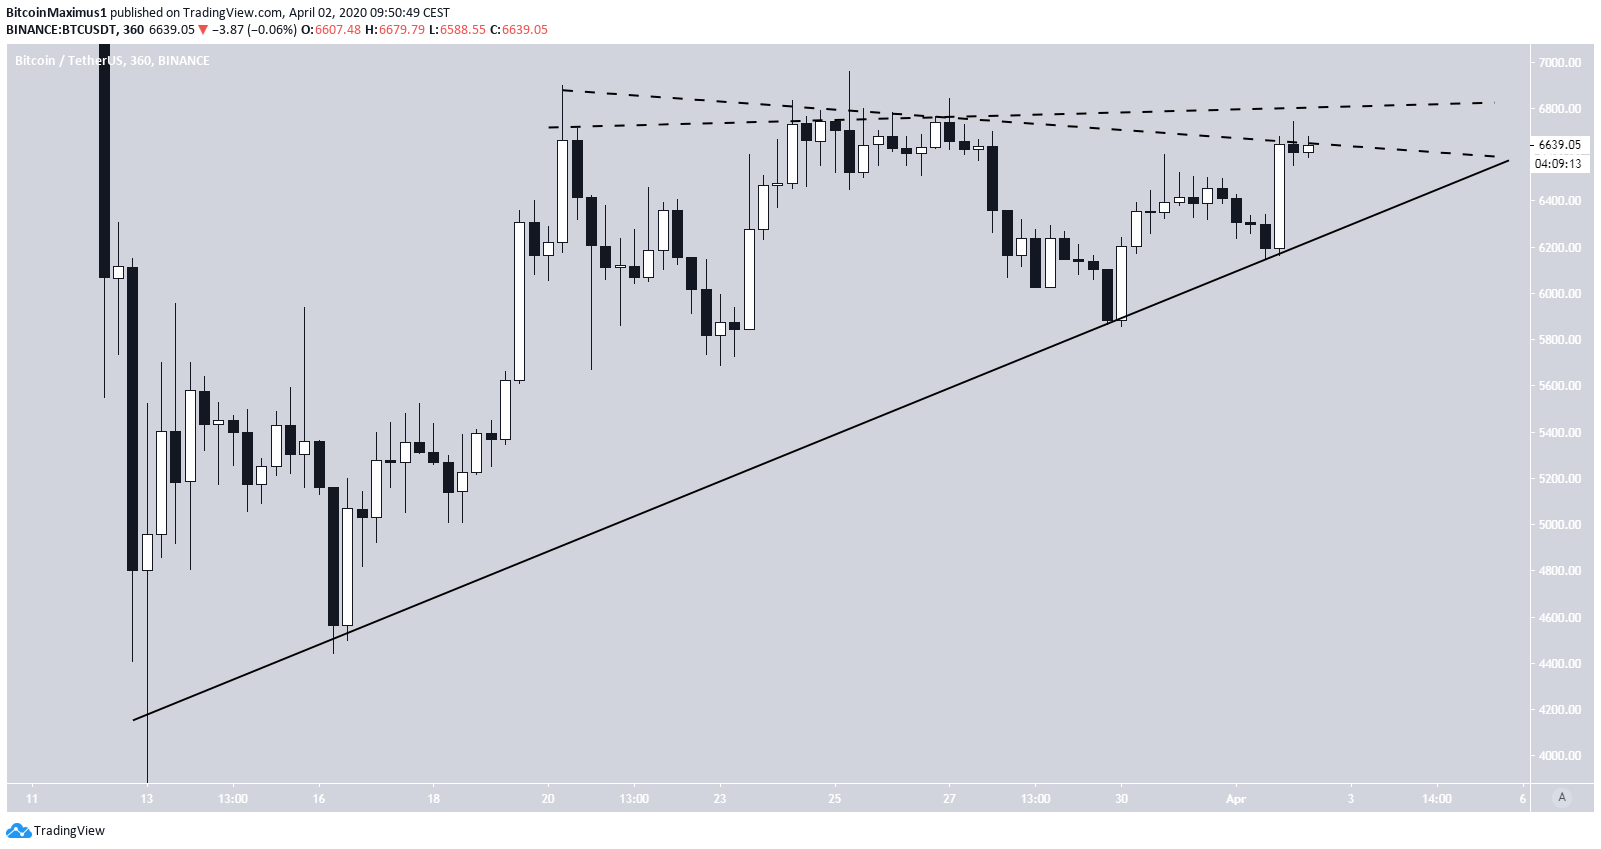
Top crypto projects in the US | April 2024
Trusted
Disclaimer
In line with the Trust Project guidelines, this price analysis article is for informational purposes only and should not be considered financial or investment advice. BeInCrypto is committed to accurate, unbiased reporting, but market conditions are subject to change without notice. Always conduct your own research and consult with a professional before making any financial decisions. Please note that our Terms and Conditions, Privacy Policy, and Disclaimers have been updated.

Valdrin Tahiri
Valdrin discovered cryptocurrencies while he was getting his MSc in Financial Markets from the Barcelona School of Economics. Shortly after graduating, he began writing for several different cryptocurrency related websites as a freelancer before eventually taking on the role of BeInCrypto's Senior Analyst.
(I do not have a discord and will not contact you first there. Beware of scammers)
READ FULL BIO
Sponsored
Sponsored