

The Bitcoin (BTC) price dropped significantly on Feb. 23, falling to a low of $44,892.
Bitcoin is expected to increase in the short-term towards $56,000 before potentially dropping once more.
Bitcoin Bounces at Support
While BTC decreased considerably yesterday, falling to a low of $44,892, it managed to bounce at the 0.5 Fib retracement level. It created a long lower wick in the process — a common sign of buying pressure.
BTC has continued its ascent today, so far reaching a high of $51,357.
While the MACD, RSI, and Stochastic oscillator have lost strength, they still show a positive reading. The RSI has even generated a hidden bullish divergence. This is a strong signal for trend continuation.

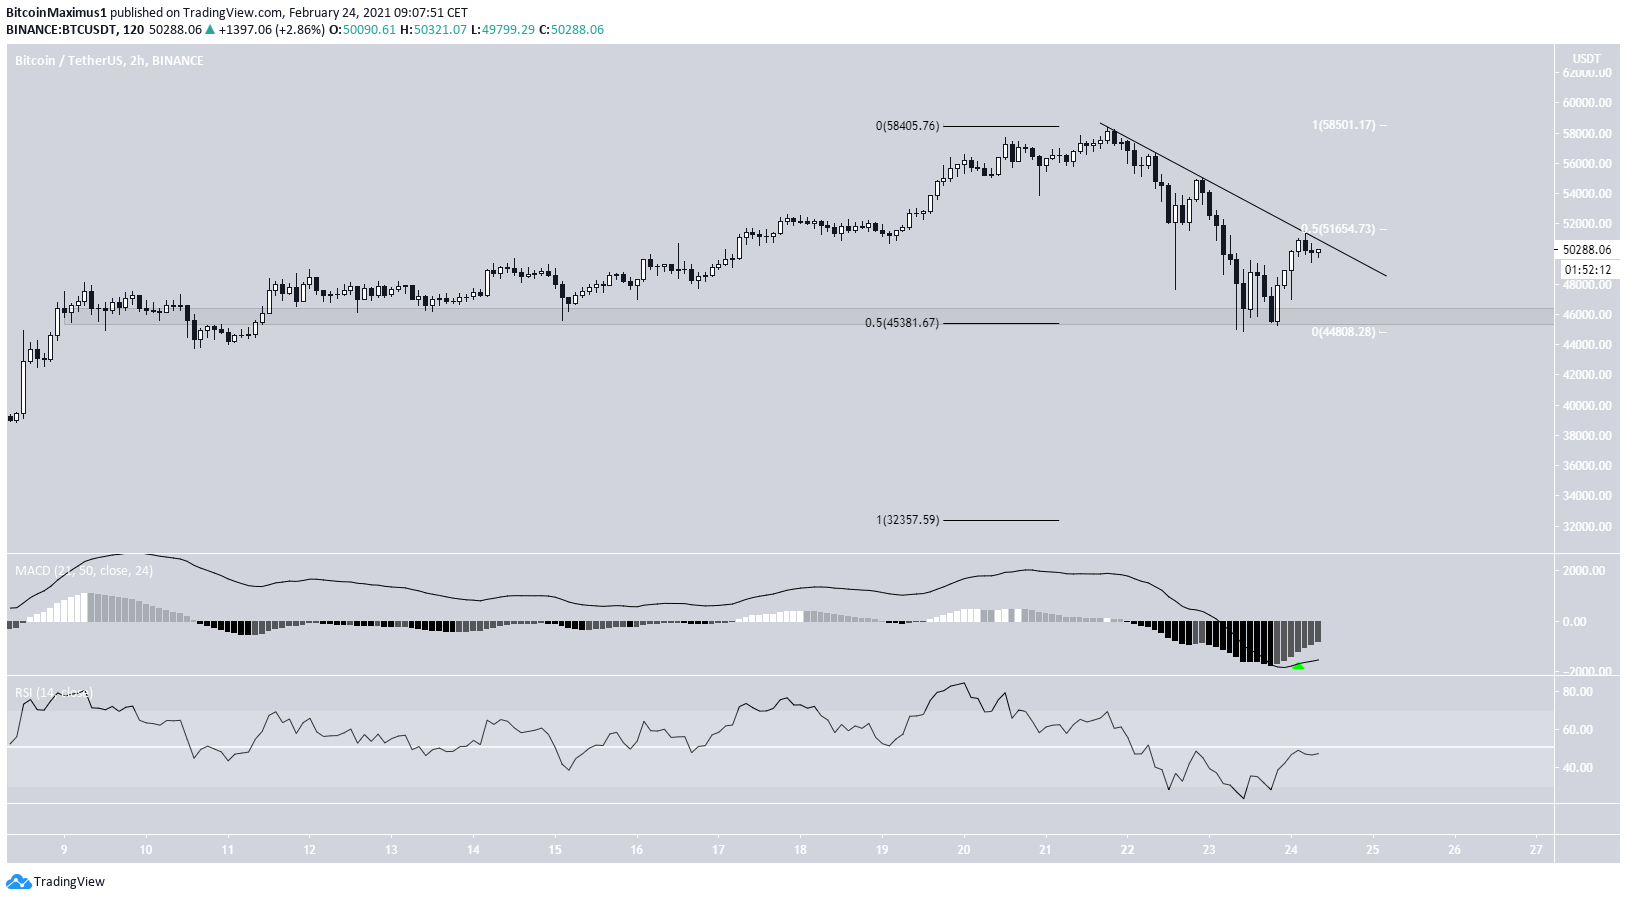
The two-hour chart shows that despite the bounce, BTC is still following a short-term descending resistance line. This line coincides with the 0.5 Fib retracement level (white) of the most recent drop at $51,600.
While the MACD and RSI are both increasing, a breakout from the line would be required for the short-term trend to be considered bullish.
If BTC manages to clear it, it would be expected to gradually move upwards and make an attempt at making a new all-time high price.
BTC Wave Count
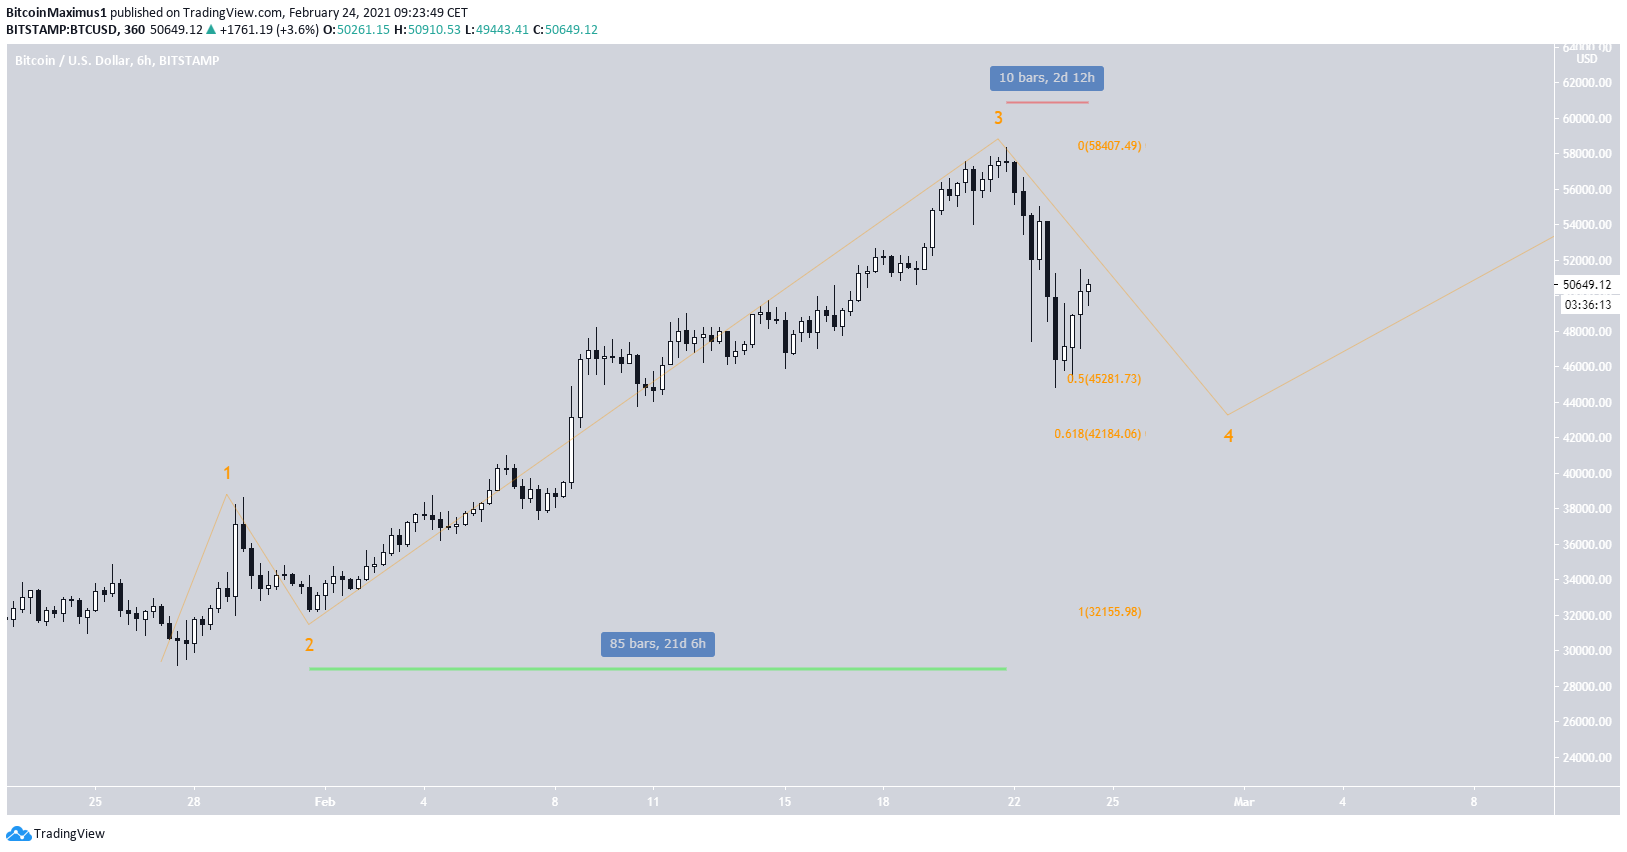
The wave count (orange) suggests that BTC is in a corrective wave four, coming after the upward move that began on Feb. 1
Considering the upward movement lasted for 21 days, it’s not likely that the correction has ended yet. It’s likely that BTC is still inside this corrective wave four.
If BTC makes a lower low, the next support area would be found at $42,400. This is the 0.618 Fib retracement of this same upward movement.
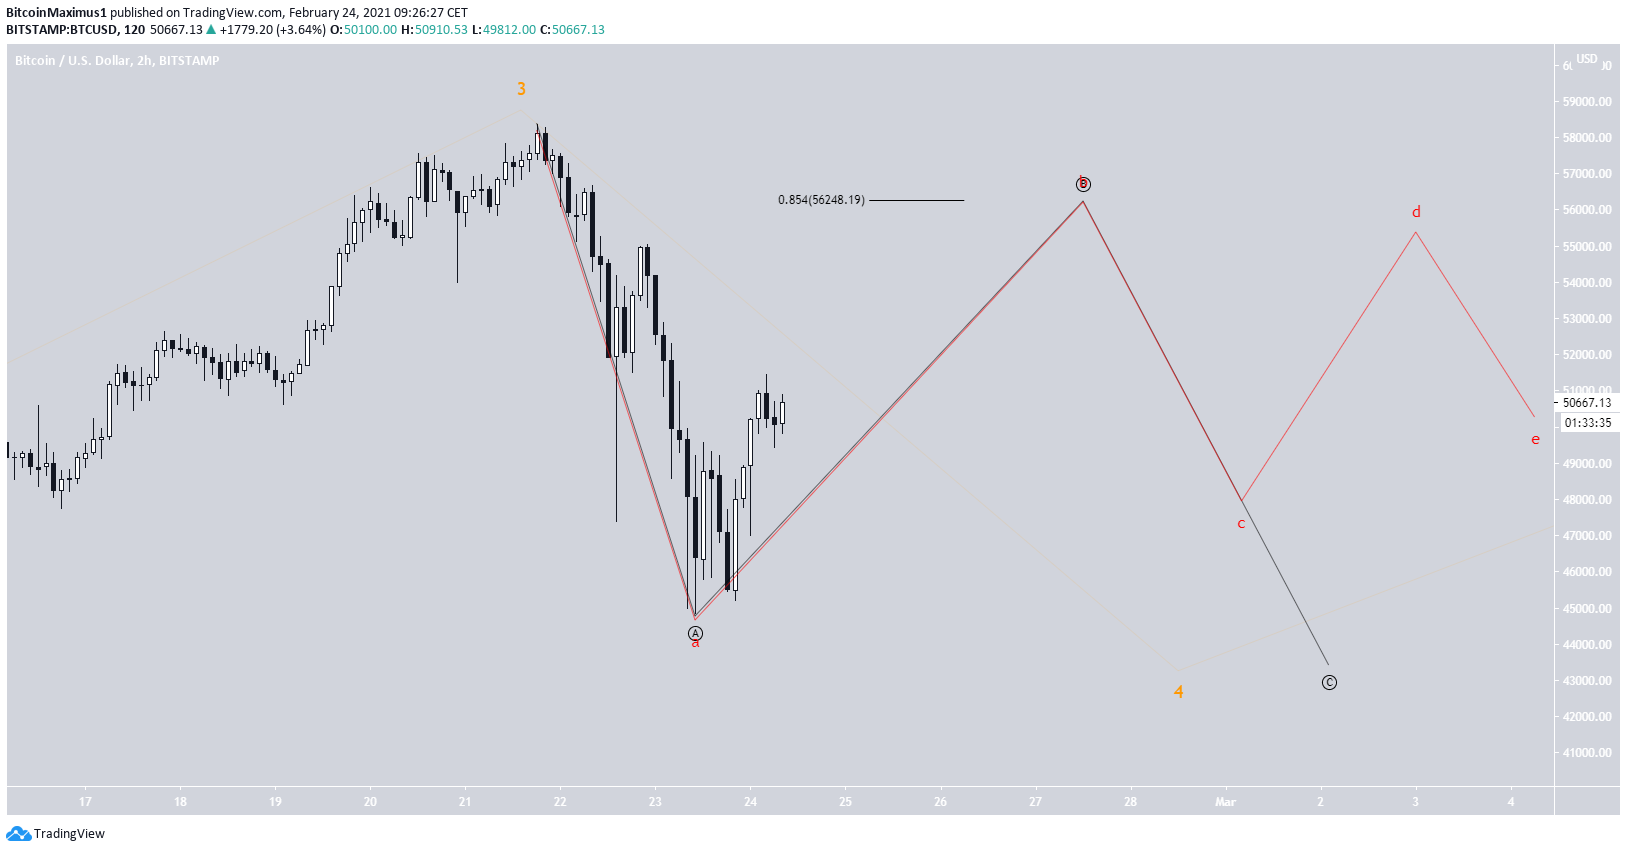
At the time of writing, we cannot determine the shape of the correction, but the two most likely ones are a regular flat (black) and a triangle (red).
Conclusion
Bitcoin is expected to increase in the short-term before potentially dropping once more to complete the current corrective movement. The shape of the correction cannot yet be determined.
For BeInCrypto’s previous Bitcoin (BTC) analysis, click here.
Trusted
Disclaimer
In line with the Trust Project guidelines, this price analysis article is for informational purposes only and should not be considered financial or investment advice. BeInCrypto is committed to accurate, unbiased reporting, but market conditions are subject to change without notice. Always conduct your own research and consult with a professional before making any financial decisions. Please note that our Terms and Conditions, Privacy Policy, and Disclaimers have been updated.
