
![Bitcoin Analysis for 2020-01-22 [Premium Analysis]](https://beincrypto.com/wp-content/uploads/2020/01/bic_quantum_computer_future_btc_bitcoin.jpg.optimal.jpg)
Bitcoin Price Highlights
- The Bitcoin price is trading inside a short-term range between $8550-$8750.
- There is resistance at $9600.
- There is support at $7600.
Ascending Wedge
The Bitcoin price broke down from an ascending wedge on January 19. However, the price did not dump quickly. Rather, it began a period of consolidation near $8600. Yesterday, the price created a bullish candlestick and has moved slightly upward. A customary movement here would be a retest of the ascending support line it has just broken down from. This movement would fit with the RSI, which has made a descending triangle. The proposed move would likely cause the RSI to touch the resistance line of the RSI.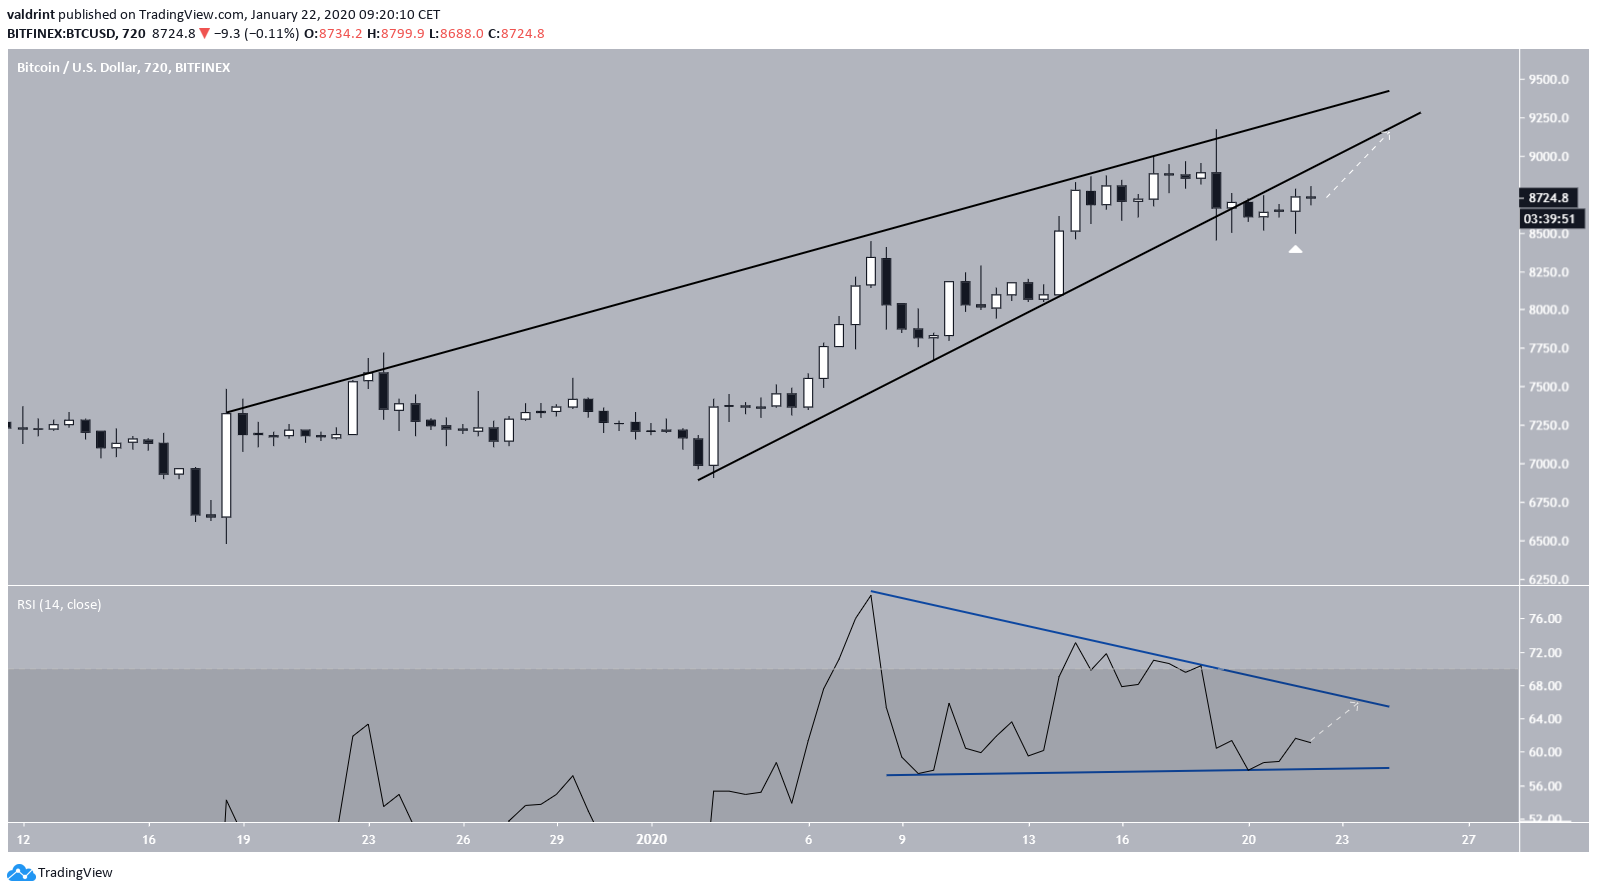
Short-Term Bitcoin Range
In the short-term, the Bitcoin price is trading in a range between $8550-$8750, having validated both several times. The price has created several long upper wicks near the $8750 resistance area, failing to successfully break through. The same thing occurred to the support area on January 19-20, and the price reversed and moved towards resistance afterward.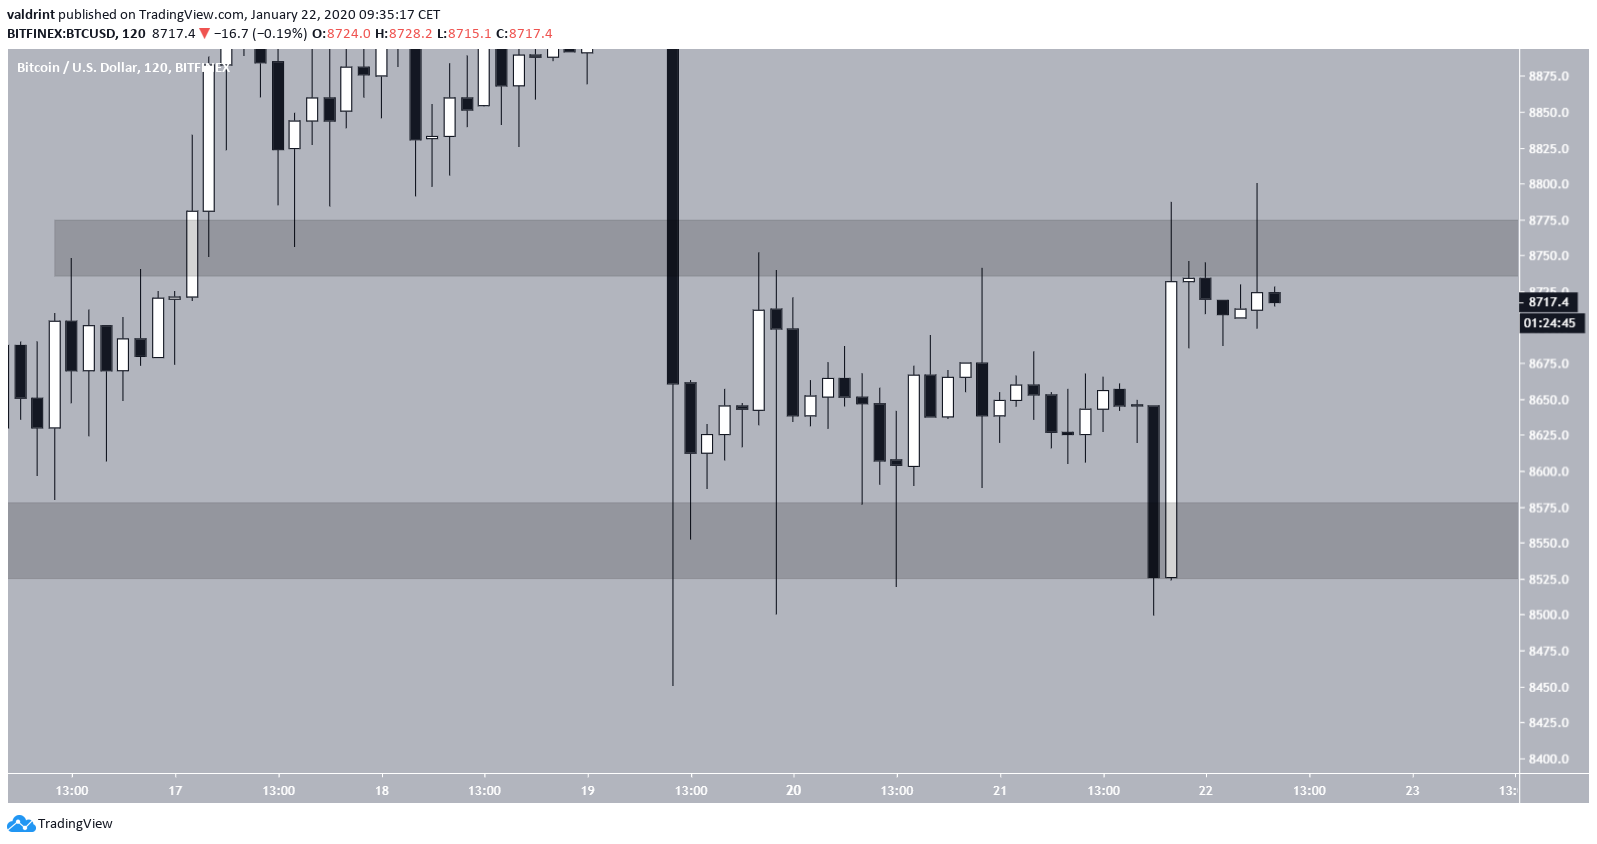 Looking closer, we can see two overthrows, which faked out the direction of the ensuing move. Late last night, the price barely decreased below the support area in the form of a wick but followed that up with a bullish engulfing candlestick that took it to the range high.
The same thing happened this morning, but the wick broke out above the resistance area before the price initiated a rapid decrease towards support.
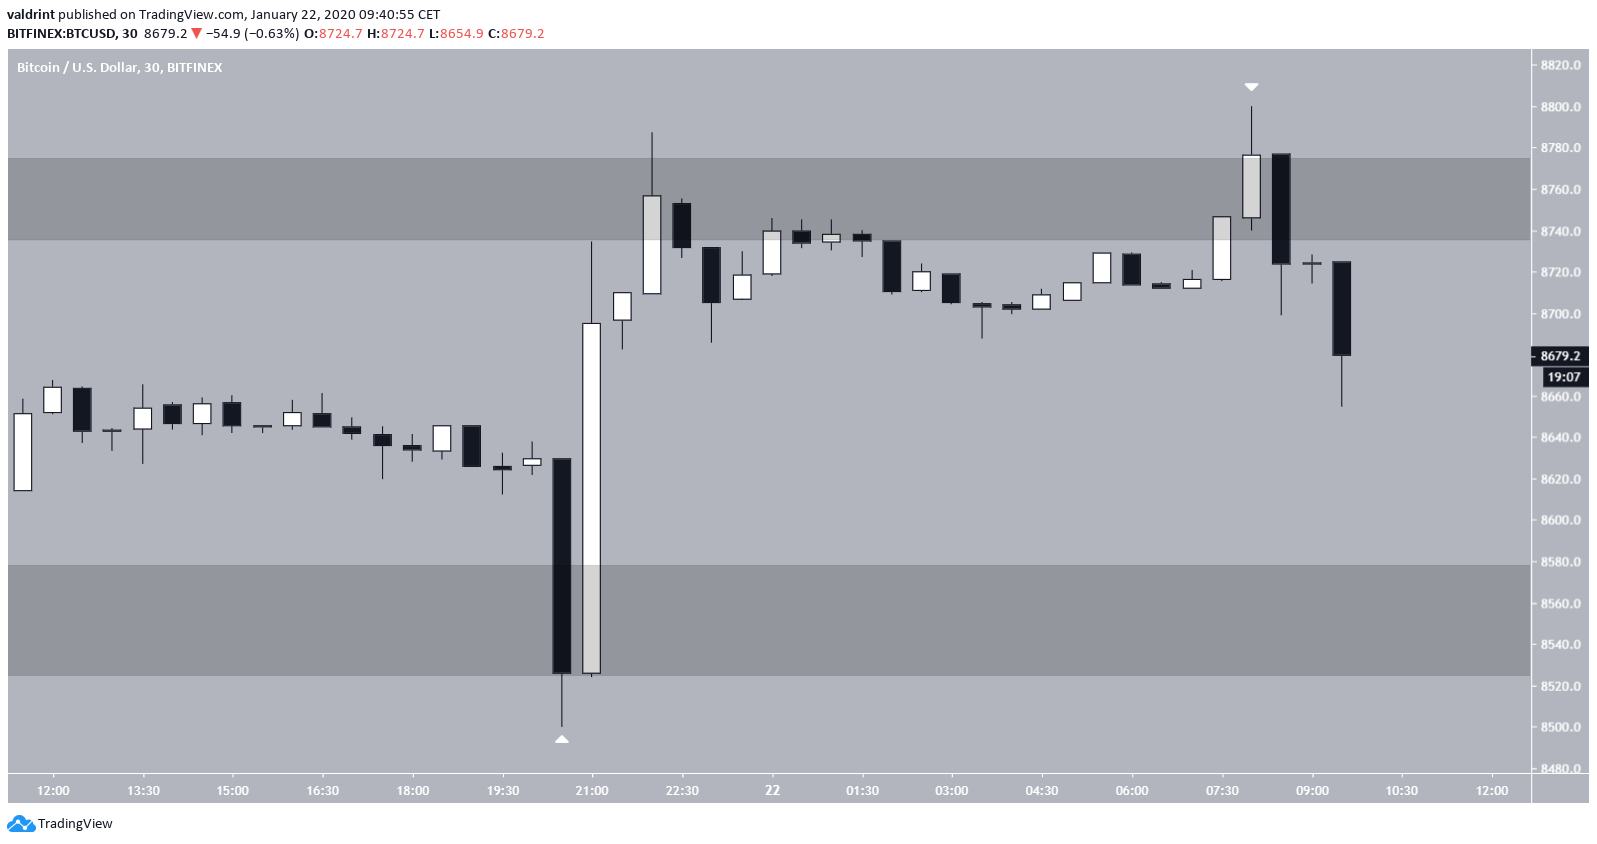
Looking closer, we can see two overthrows, which faked out the direction of the ensuing move. Late last night, the price barely decreased below the support area in the form of a wick but followed that up with a bullish engulfing candlestick that took it to the range high.
The same thing happened this morning, but the wick broke out above the resistance area before the price initiated a rapid decrease towards support.
Resistance Areas
The daily chart reveals that the price has been increasing since December 17, 2019. In addition, while the candlestick that caused the price to break down from the wedge was significant, both its magnitude and volume is smaller than several bullish candlesticks prior. So, we do not think that this candle provides sufficient evidence that the current rally has ended. Rather, it can be seen as a retracement that is a part of a larger, bullish trend. If the price continues its upward movement, it is likely to find resistance at $9600. Conversely, a breakdown could take the price to $7800. At the current time, we do not think this is likely.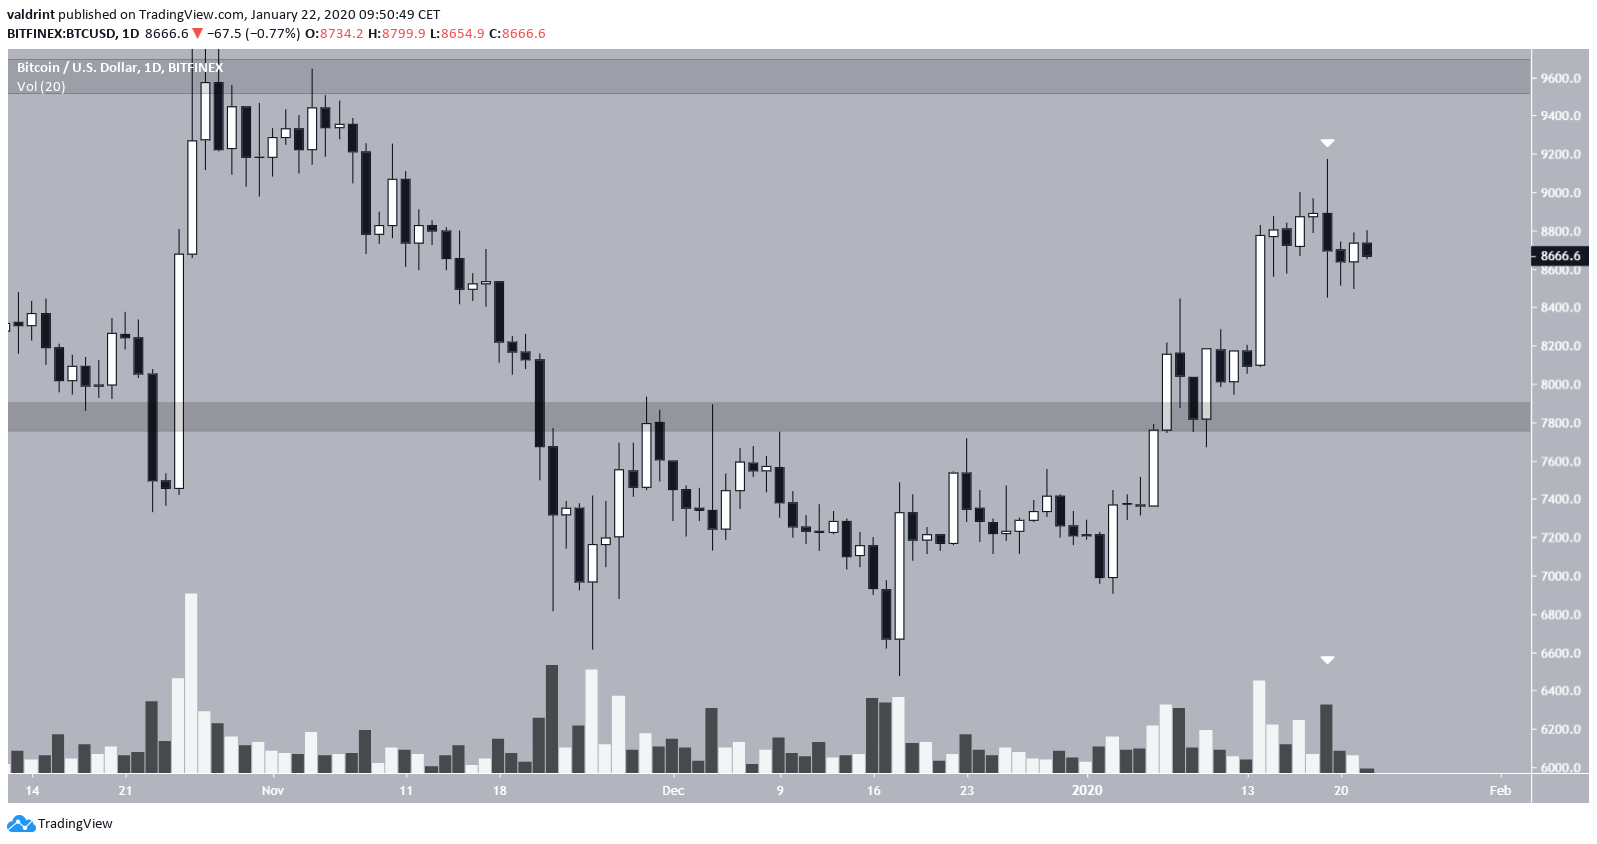 To conclude, the Bitcoin price has been in a period of consolidation since breaking down from an ascending wedge. While the breakdown was swift, we do not think it is sufficient to call an end to the current upward trend. If the price continues its upward movement, the $9600 resistance area is likely to act as the top.
For our previous analysis, click here.
To conclude, the Bitcoin price has been in a period of consolidation since breaking down from an ascending wedge. While the breakdown was swift, we do not think it is sufficient to call an end to the current upward trend. If the price continues its upward movement, the $9600 resistance area is likely to act as the top.
For our previous analysis, click here.
Top crypto projects in the US | April 2024
Trusted
Disclaimer
In line with the Trust Project guidelines, this price analysis article is for informational purposes only and should not be considered financial or investment advice. BeInCrypto is committed to accurate, unbiased reporting, but market conditions are subject to change without notice. Always conduct your own research and consult with a professional before making any financial decisions. Please note that our Terms and Conditions, Privacy Policy, and Disclaimers have been updated.

Valdrin Tahiri
Valdrin discovered cryptocurrencies while he was getting his MSc in Financial Markets from the Barcelona School of Economics. Shortly after graduating, he began writing for several different cryptocurrency related websites as a freelancer before eventually taking on the role of BeInCrypto's Senior Analyst.
(I do not have a discord and will not contact you first there. Beware of scammers)
READ FULL BIO
Sponsored
Sponsored