
![Bitcoin Analysis for 2020-01-06 [Premium Analysis]](https://beincrypto.com/wp-content/uploads/2019/01/bic_bitcoin_positive_feedback.jpg.optimal.jpg)
Bitcoin Price Highlights
- The Bitcoin price is trading inside of an ascending channel.
- There is a bearish divergence in the lower time-frame RSI & MACD.
- There is minor resistance at $7600.
- The price has created a longer-term inverse head and shoulders (H&S) pattern.
Ascending Channel
The Bitcoin price broke down below the minor support area near $7100 on January 2. However, it immediately reversed and created a bullish engulfing candlestick. Since then, it has been gradually increasing, trading inside an ascending channel — having validated both the resistance and support lines thrice. While volume has been decreasing throughout the entire move, indicating some weakness, the movement towards resistance has been faster than that towards support. On January 6, the price reached the support line of the channel and increased all the way to resistance in only four hourly candles. If the price continues trading inside this channel, it will reach the minor resistance area at $7600 sometime tomorrow.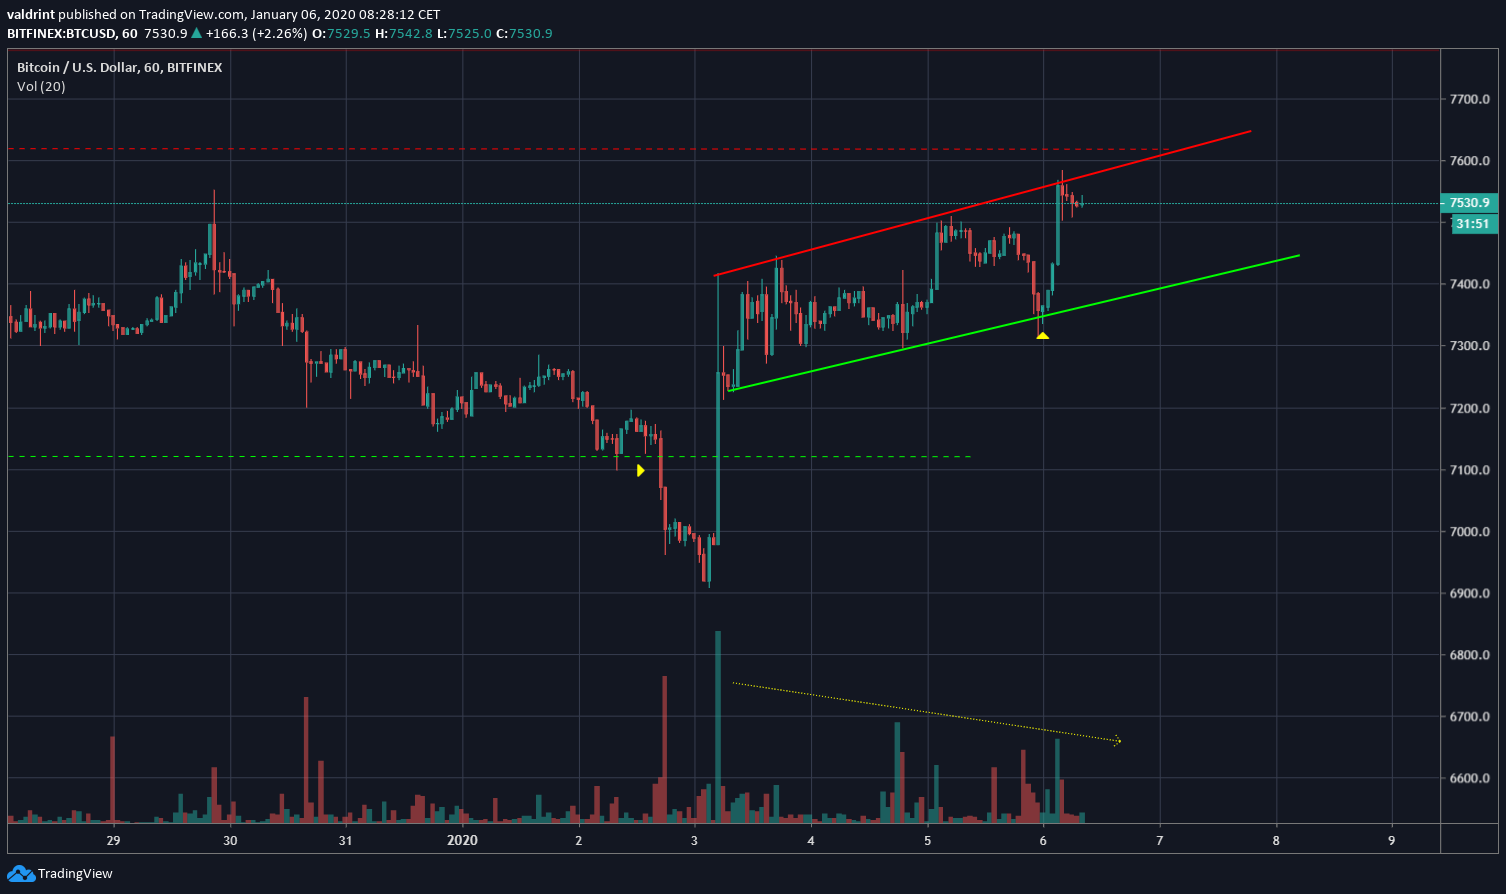 Both the RSI & the MACD show a developing bearish divergence throughout the entire channel, albeit only visible in lower time-frames.
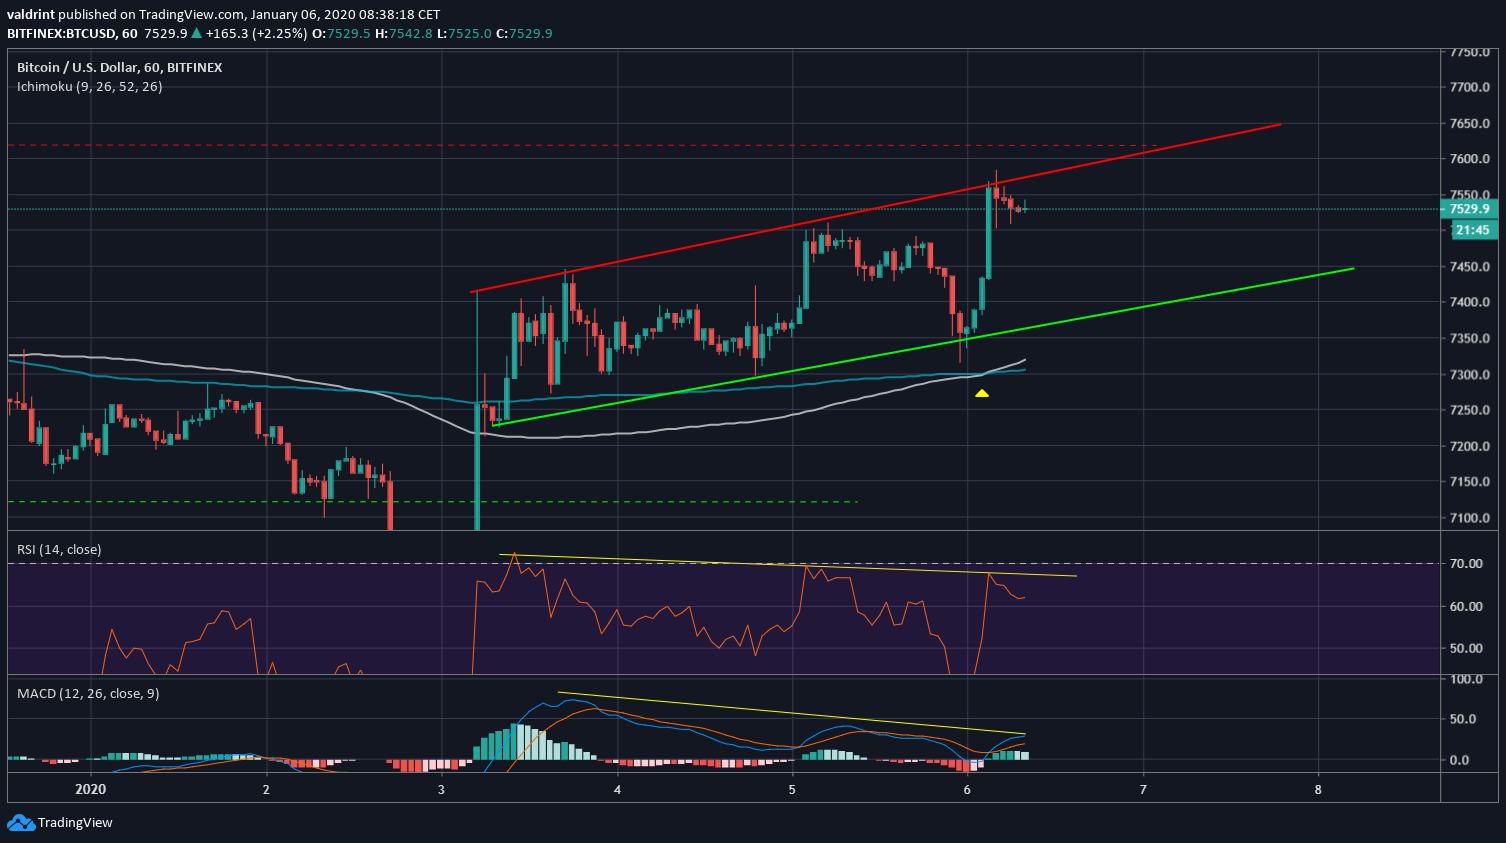
On a bullish note, the 100- and 200-hour moving averages (MAs) have just made a bullish cross and are providing support to the price. Thus, the divergence makes it unlikely that the price will break out, suggesting that it will trade inside the channel instead. This stands true as long as the trend-line of the divergence is intact.
On the other hand, a breakdown below the support line would also constitute a breakdown below the MAs, making the $7350 level a suitable place for a stop loss placement — especially since both the MAs and support line are ascending.
Both the RSI & the MACD show a developing bearish divergence throughout the entire channel, albeit only visible in lower time-frames.
On a bullish note, the 100- and 200-hour moving averages (MAs) have just made a bullish cross and are providing support to the price. Thus, the divergence makes it unlikely that the price will break out, suggesting that it will trade inside the channel instead. This stands true as long as the trend-line of the divergence is intact.
On the other hand, a breakdown below the support line would also constitute a breakdown below the MAs, making the $7350 level a suitable place for a stop loss placement — especially since both the MAs and support line are ascending.
Inverse Head and Shoulders
The Bitcoin price has been trading inside a longer-term inverse H&S pattern since late November. It is trading right at the descending resistance line (neckline) of the pattern. Additionally, it has moved above the 50-day MA, which it had been struggling to do earlier. A breakout that travels the entire height of the pattern would take the price to $8800, right at the resistance line of the descending channel in place since June. As long as the price does not break down from the short-term ascending channel, this seems likely, after possibly some more consolidation inside the channel.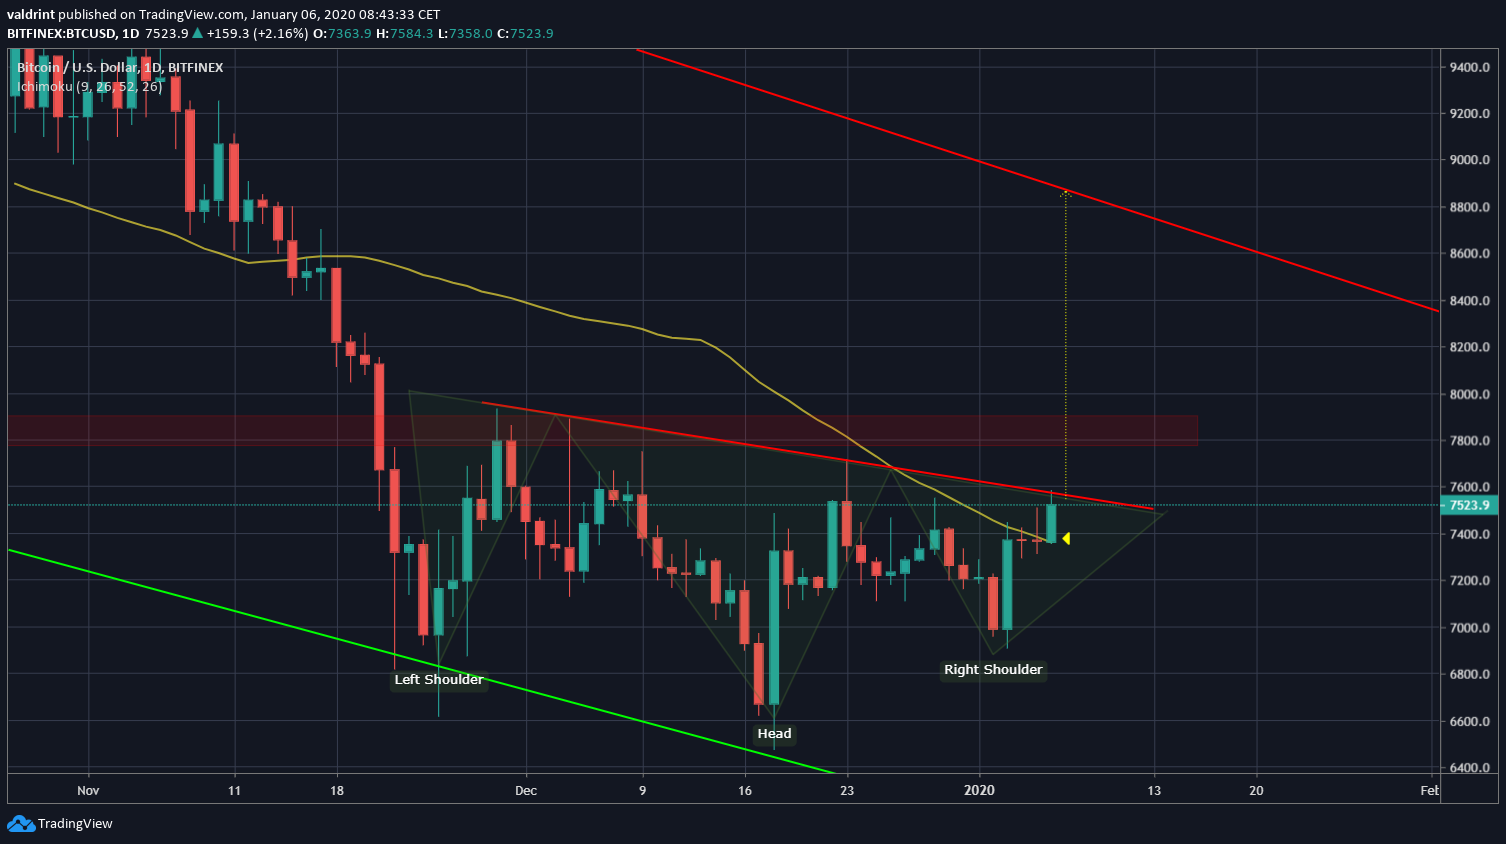 To conclude, the BTC price is trading inside a short-term ascending channel and has created a longer-term inverse H&S pattern. A breakout from this pattern could take the price all the way to $8800.
Good luck and happy trading! For our previous analysis, click here.
To conclude, the BTC price is trading inside a short-term ascending channel and has created a longer-term inverse H&S pattern. A breakout from this pattern could take the price all the way to $8800.
Good luck and happy trading! For our previous analysis, click here.
Top crypto projects in the US | April 2024
Trusted
Disclaimer
In line with the Trust Project guidelines, this price analysis article is for informational purposes only and should not be considered financial or investment advice. BeInCrypto is committed to accurate, unbiased reporting, but market conditions are subject to change without notice. Always conduct your own research and consult with a professional before making any financial decisions. Please note that our Terms and Conditions, Privacy Policy, and Disclaimers have been updated.

Valdrin Tahiri
Valdrin discovered cryptocurrencies while he was getting his MSc in Financial Markets from the Barcelona School of Economics. Shortly after graduating, he began writing for several different cryptocurrency related websites as a freelancer before eventually taking on the role of BeInCrypto's Senior Analyst.
(I do not have a discord and will not contact you first there. Beware of scammers)
READ FULL BIO
Sponsored
Sponsored