
On May 21, 2019, Binance Coin (BNB) reached an all-time high (ATH). On the same day, Tron (TRX) validated the resistance line of its current trading pattern. However, TRX was unable to break out and has been a slow decline.
In this continuing analysis of BNB and TRX, we assess the most recent price fluctuations, various trends, and a series of technical indicators for both.
Will BNB continue rising to higher highs? Will TRX fall down to its support line?
Let’s find out!
Tron’s Triangle
On May 10, the price of TRX/USD reached a low of $0.021 and generated an ascending support line. A gradual increase followed. It intensified on May 14 and reached a peak two days later with an apparent top of $0.033. After validating the support line, a gradual increase ensued. Two resistance lines can be traced. The sold resistance line generates an ascending channel while the dotted line generates an ascending triangle: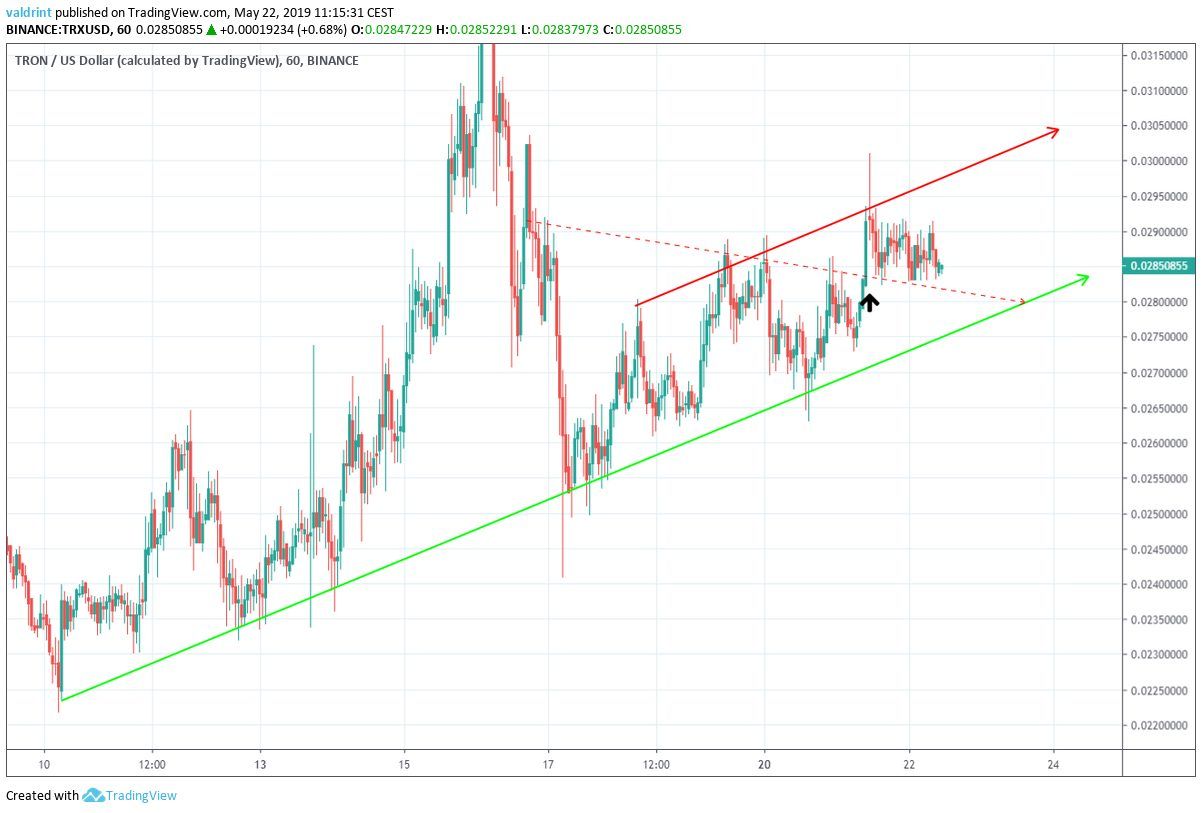 On May 21, the price broke out from the triangle. It briefly traded above $0.03, before initiating a slight reversal. Since that time, it appears to be following the dotted resistance line as support.
It appears likely that TRX will continue falling along this new support until reaching the solid green support line. To better assess this possibility, the price of TRX is analyzed at daily intervals alongside the RSI and the MACD below:
On May 21, the price broke out from the triangle. It briefly traded above $0.03, before initiating a slight reversal. Since that time, it appears to be following the dotted resistance line as support.
It appears likely that TRX will continue falling along this new support until reaching the solid green support line. To better assess this possibility, the price of TRX is analyzed at daily intervals alongside the RSI and the MACD below:
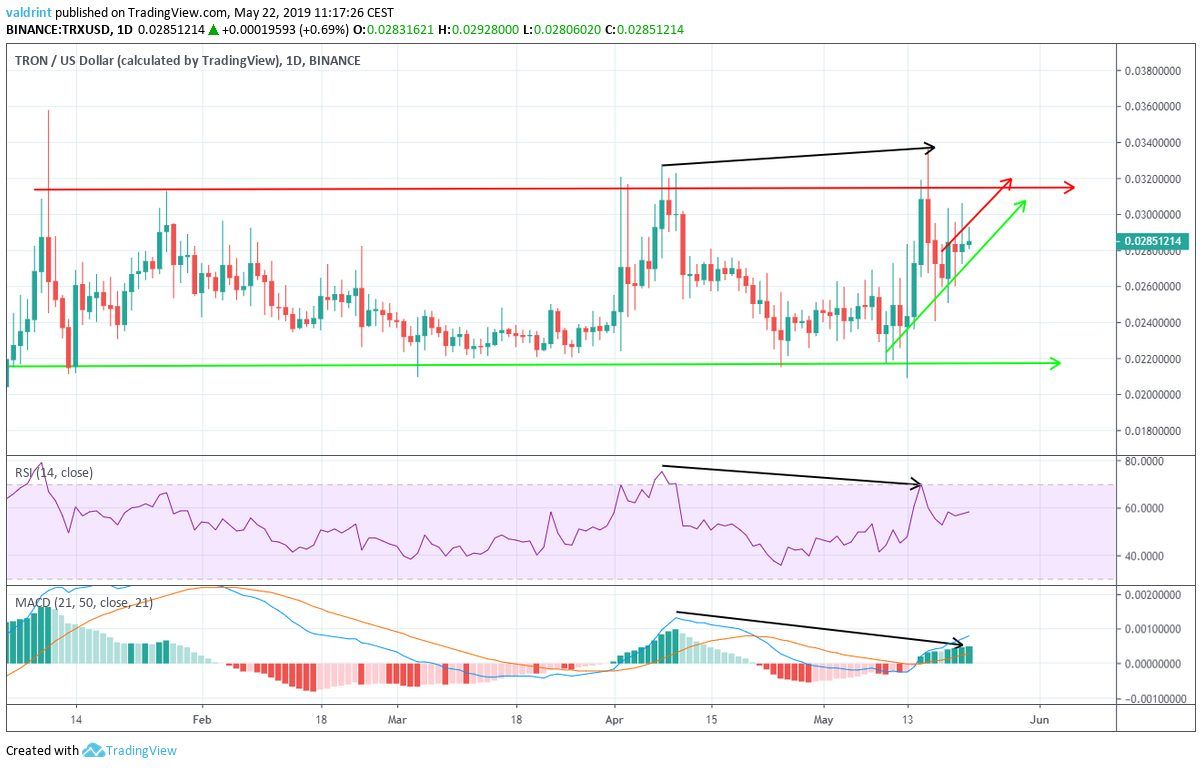 We can see that the price has been trading inside a horizontal channel with resistance and support lines near $0.0315 and $0.022 respectively.
Since reaching a high on Apr 12, the price began to generate bearish divergence in both the RSI and the MACD. This continued until fairly recently, during which time TRX suffered general price losses. As the RSI and MACD began to increase, however so too did TRX.
If RSI and MACD continue increasing, the price of TRX may continue upward to reach the long-term resistance line. However, the recent bearish divergence may continue and cause price decreases soon thereafter.
We can see that the price has been trading inside a horizontal channel with resistance and support lines near $0.0315 and $0.022 respectively.
Since reaching a high on Apr 12, the price began to generate bearish divergence in both the RSI and the MACD. This continued until fairly recently, during which time TRX suffered general price losses. As the RSI and MACD began to increase, however so too did TRX.
If RSI and MACD continue increasing, the price of TRX may continue upward to reach the long-term resistance line. However, the recent bearish divergence may continue and cause price decreases soon thereafter.
Binance Coin (BNB) In an Ascending Wedge
On Jan 30, the price reached a low of $6.02. A gradual increase began and the price reached a high of $10.08 on Feb 11. Since then, it has been increasing inside the ascending broadening wedge outline below: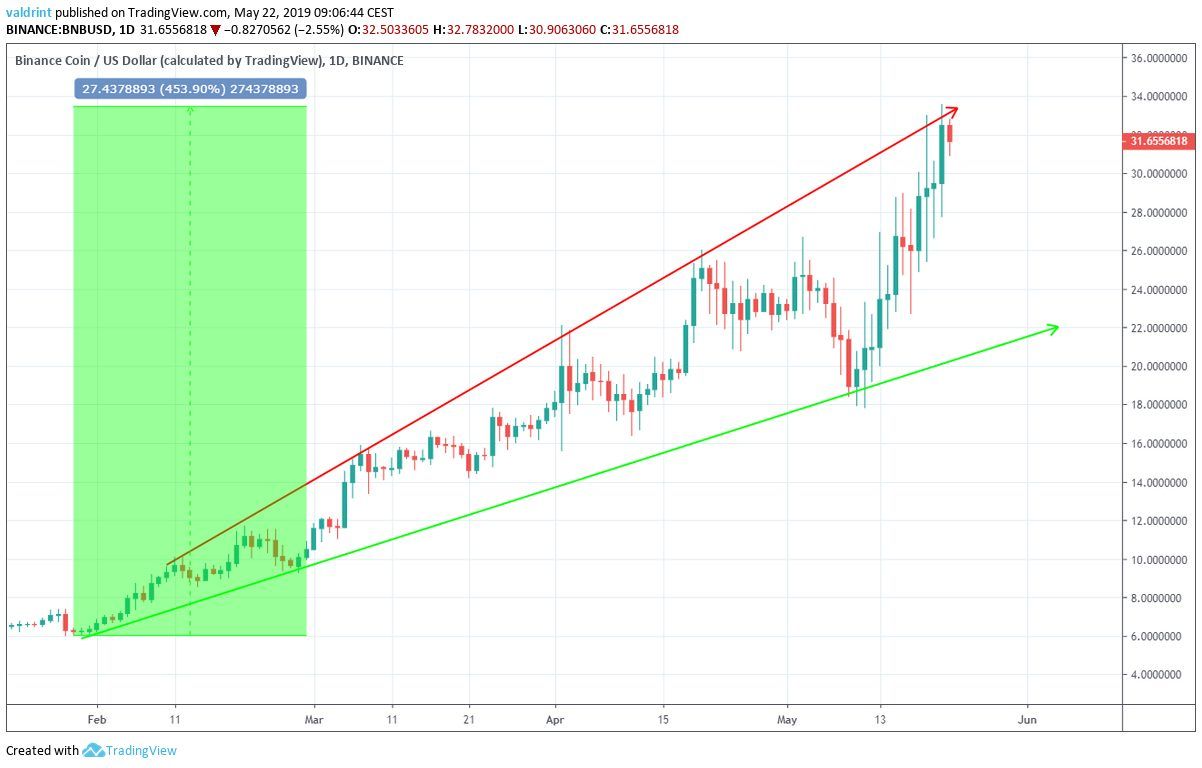 While inside this wedge, the price has increased by 453%. Furthermore, BNB an all-time high price of $33.58 on May 21. This caused the resistance line to be validated.
Thus, continued price increases appear likely to lead BNB to a breakout. However, the price may drop toward the support line.
In order to predict which is more likely, BNB is analyzed at daily intervals alongside the RSI and the MACD below:
While inside this wedge, the price has increased by 453%. Furthermore, BNB an all-time high price of $33.58 on May 21. This caused the resistance line to be validated.
Thus, continued price increases appear likely to lead BNB to a breakout. However, the price may drop toward the support line.
In order to predict which is more likely, BNB is analyzed at daily intervals alongside the RSI and the MACD below:
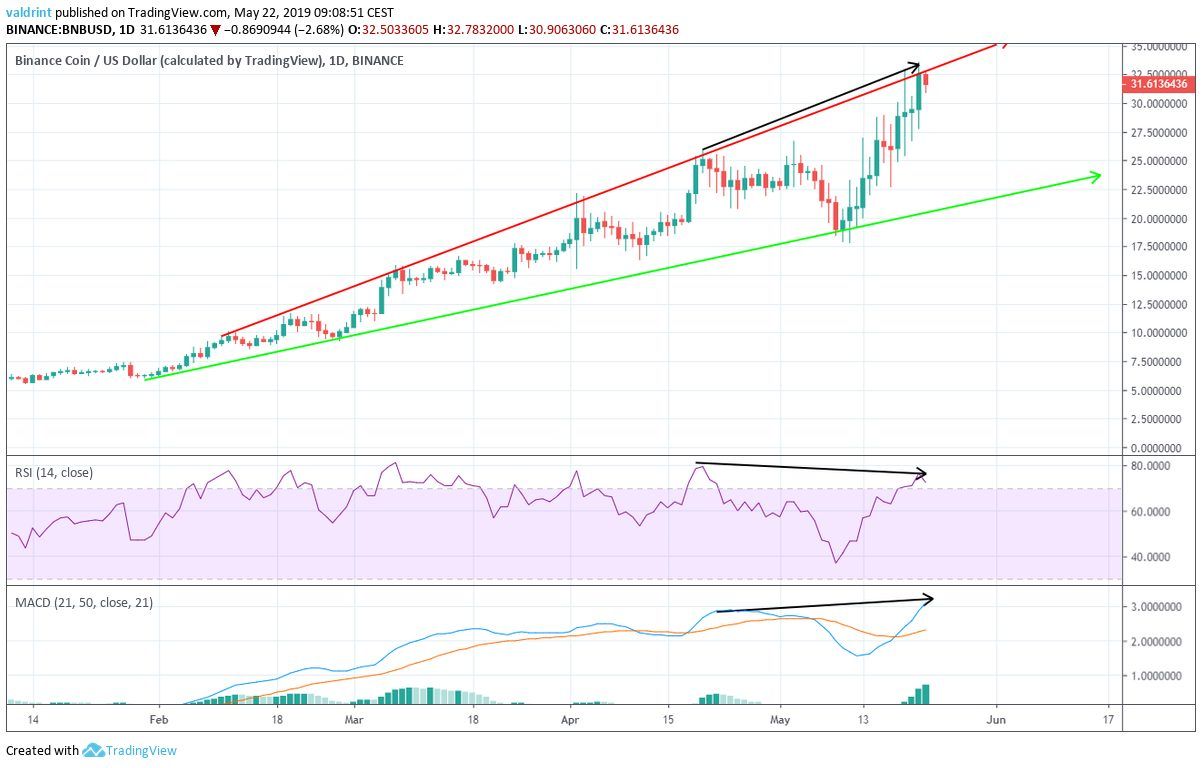 Since reaching the high on Apr 20, the price has started to generate bearish divergence in the RSI. This was especially evident during the May 21 high. However, the same did not happen in the MACD.
It appears likely that the price of BNB may drop toward the support line in the near future. Increases may follow, but they are likely to occur within the confines of the wedge. Any breakout at this point is likely going to precede a reversal back into the wedge.
Since reaching the high on Apr 20, the price has started to generate bearish divergence in the RSI. This was especially evident during the May 21 high. However, the same did not happen in the MACD.
It appears likely that the price of BNB may drop toward the support line in the near future. Increases may follow, but they are likely to occur within the confines of the wedge. Any breakout at this point is likely going to precede a reversal back into the wedge.
Disclaimer
In line with the Trust Project guidelines, this price analysis article is for informational purposes only and should not be considered financial or investment advice. BeInCrypto is committed to accurate, unbiased reporting, but market conditions are subject to change without notice. Always conduct your own research and consult with a professional before making any financial decisions. Please note that our Terms and Conditions, Privacy Policy, and Disclaimers have been updated.

Valdrin Tahiri
Valdrin discovered cryptocurrencies while he was getting his MSc in Financial Markets from the Barcelona School of Economics. Shortly after graduating, he began writing for several different cryptocurrency related websites as a freelancer before eventually taking on the role of BeInCrypto's Senior Analyst.
(I do not have a discord and will not contact you first there. Beware of scammers)
READ FULL BIO
Sponsored
Sponsored