

Binance Coin (BNB) increased significantly on Wednesday and is making it sixth attempt at breaking out from a bullish short-term pattern.
In order to tackle its scaling issues, BNB announced that it was releasing the zkBNB testnet. The testnet can support 100 Million addresses and handle up to 10,000 transactions per second.
As a result, the new testnet is expected to help develops build large-scale BNB smart chain-based applications with higher transaction speeds and lower transaction fees.
The way zkBNB works is that it gathers sidechain transactions into one single transaction which generates a cryptographic proof, usually referred to as SNARK.
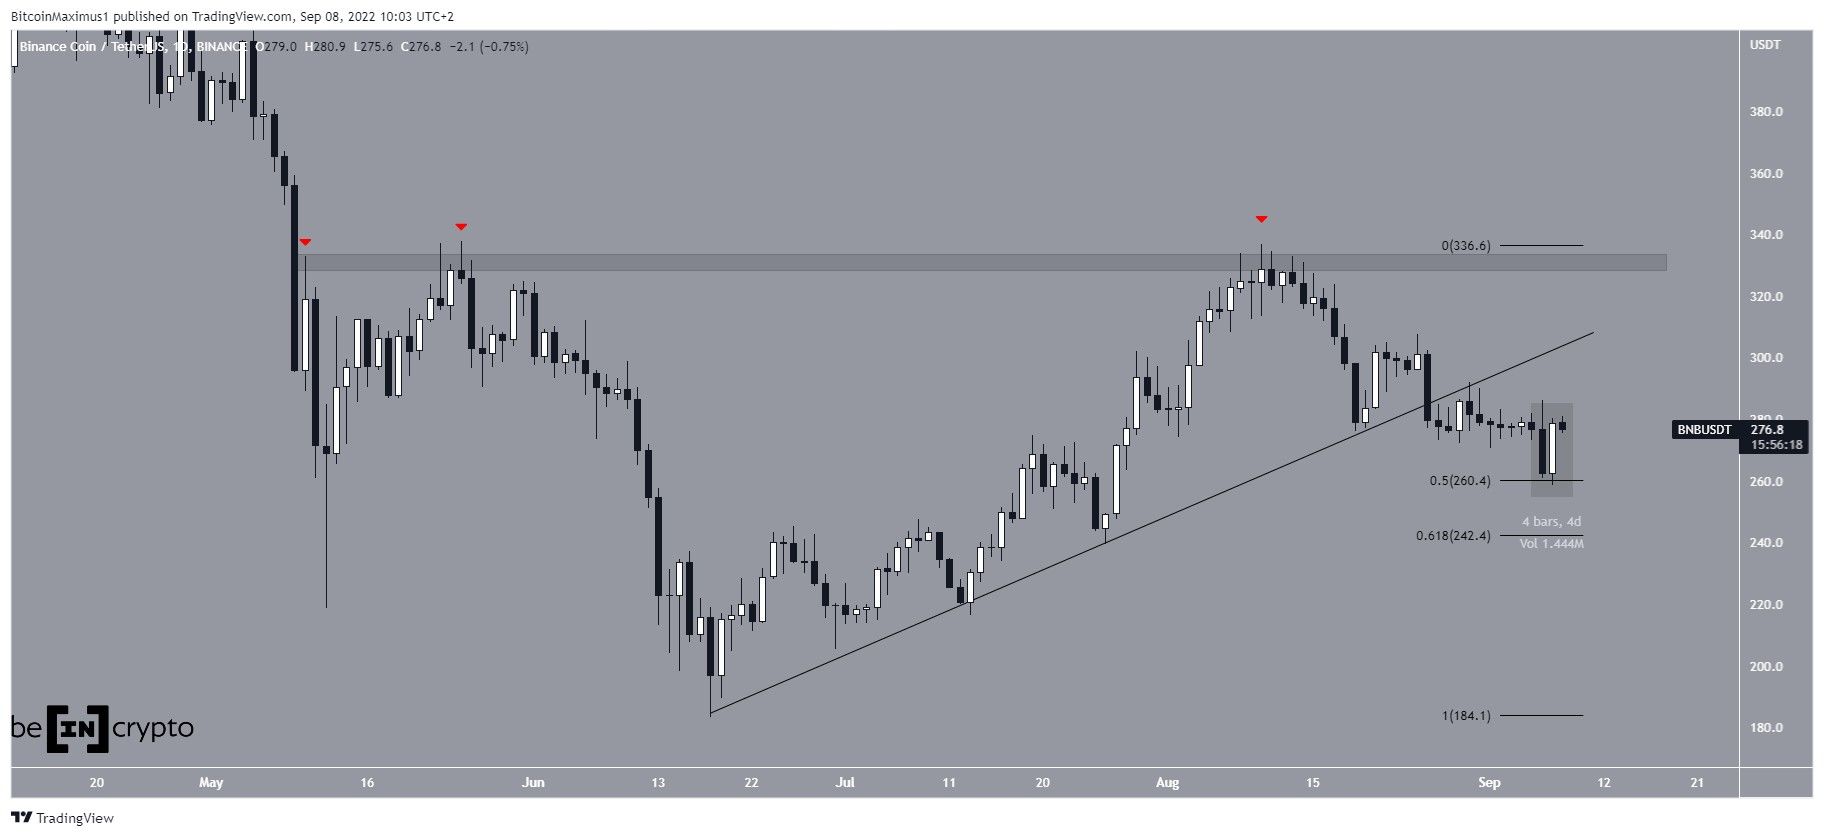
Bullish engulfing candlestick
These developments seem to have had a positive impact in the BNB price. On Wednesday, the price created a bullish engulfing candlestick (highlighted). Such candlesticks are considered strong signs of bullish trends, since the entire previous days decrease is negated with one bullish candlestick.
Additionally, the price bounced at the 0.5 Fib retracement support level at $260. This further increases the legitimacy of the bullish engulfing candlestick.
If the price manages to reclaim the ascending support line from which it previously broke down, it would be expected to increase towards the next resistance at $330.
Future BNB movement
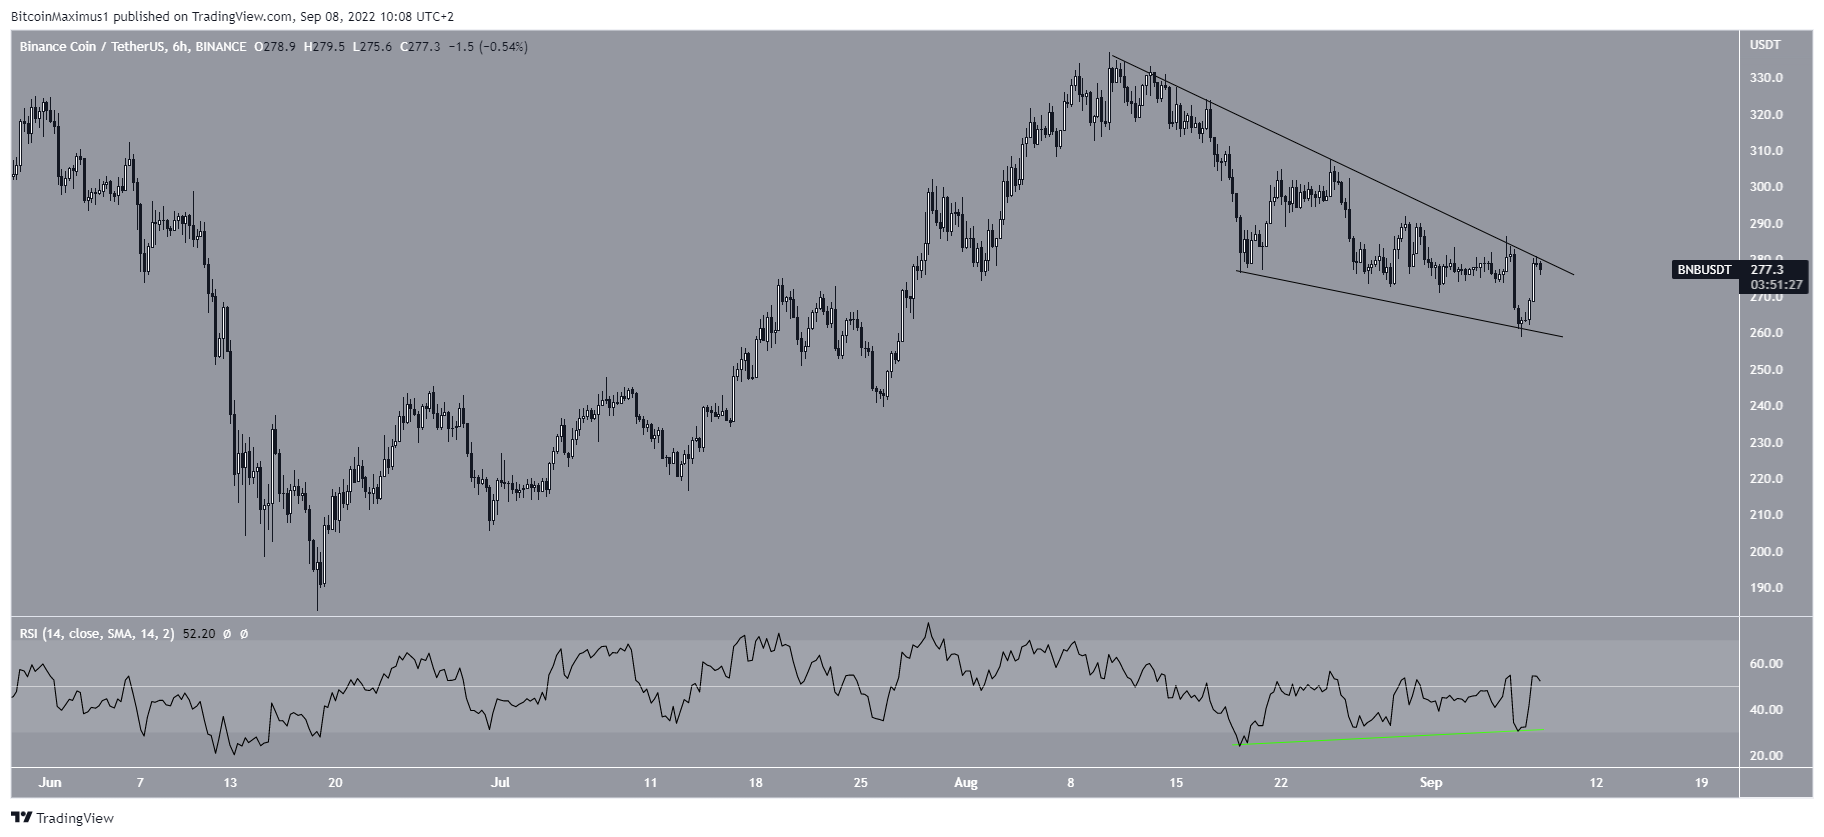
The six-hour chart provides a more bullish outlook for two reasons.
First, BNB has been trading inside a descending wedge since its Aug 8 highs. The descending wedge is considered a bullish pattern, meaning that it leads to breakouts the majority of the time. The price bounced at its support line and is currently making its sixth attempt at breaking out.
Secondly, the six-hour RSI has generated a very significant amount of bullish divergence (green line). Such divergences often precede price breakouts. This possibility is strengthened by the fact that BNB is trading inside a bullish pattern.
A breakdown from the wedge and in turn the 0.5 Fib retracement support level would invalidate this possibility.
For Be[in]Crypto’s latest Bitcoin (BTC) analysis, click here
Disclaimer
In line with the Trust Project guidelines, this price analysis article is for informational purposes only and should not be considered financial or investment advice. BeInCrypto is committed to accurate, unbiased reporting, but market conditions are subject to change without notice. Always conduct your own research and consult with a professional before making any financial decisions. Please note that our Terms and Conditions, Privacy Policy, and Disclaimers have been updated.
