

Binance Coin (BNB) is trading very close to a long-term resistance level, above which it has been attempting to break out for the past ten days.
While the direction of the next move is not entirely clear, a breakout seems more likely.
BNB Horizontal Levels
The BNB price began a rapid upward movement after a sharp drop on Sept 4. In a span of only ten days, the price proceeded to regain all of its previous losses to reach a new yearly high of $33.35 on Sept 14. After a corrective movement, BNB reclaimed the $26.70 area, which is now expected to act as support. Conversely, the closest resistance area is found at $31.70. Since the beginning of October, BNB has been trading between these two levels but is closer to the latter.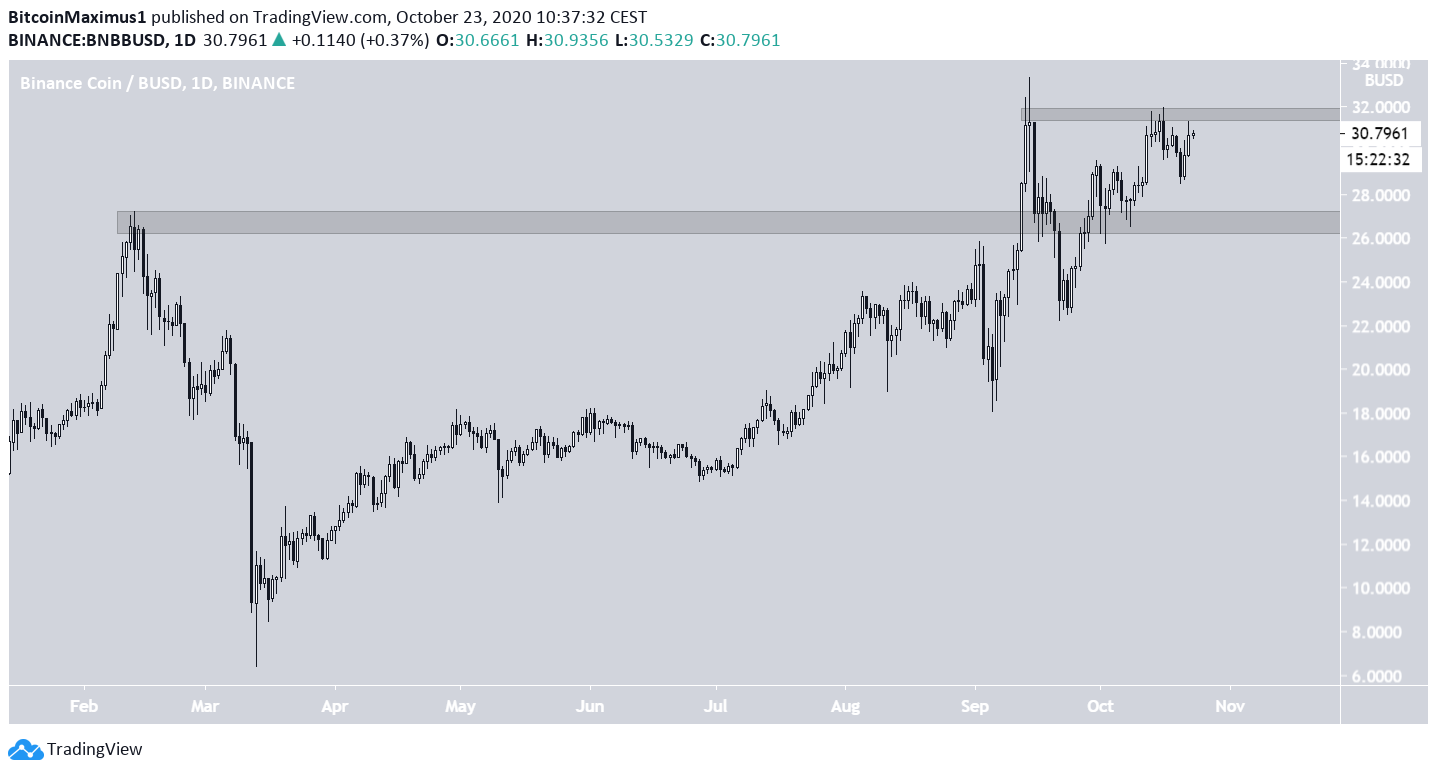
Possible Breakout
Cryptocurrency trader @raticoin1 outlined a BNB chart, stating that if the price breaks out from the current resistance area, it could increase all the way to $40 and reaching a new all-time high after.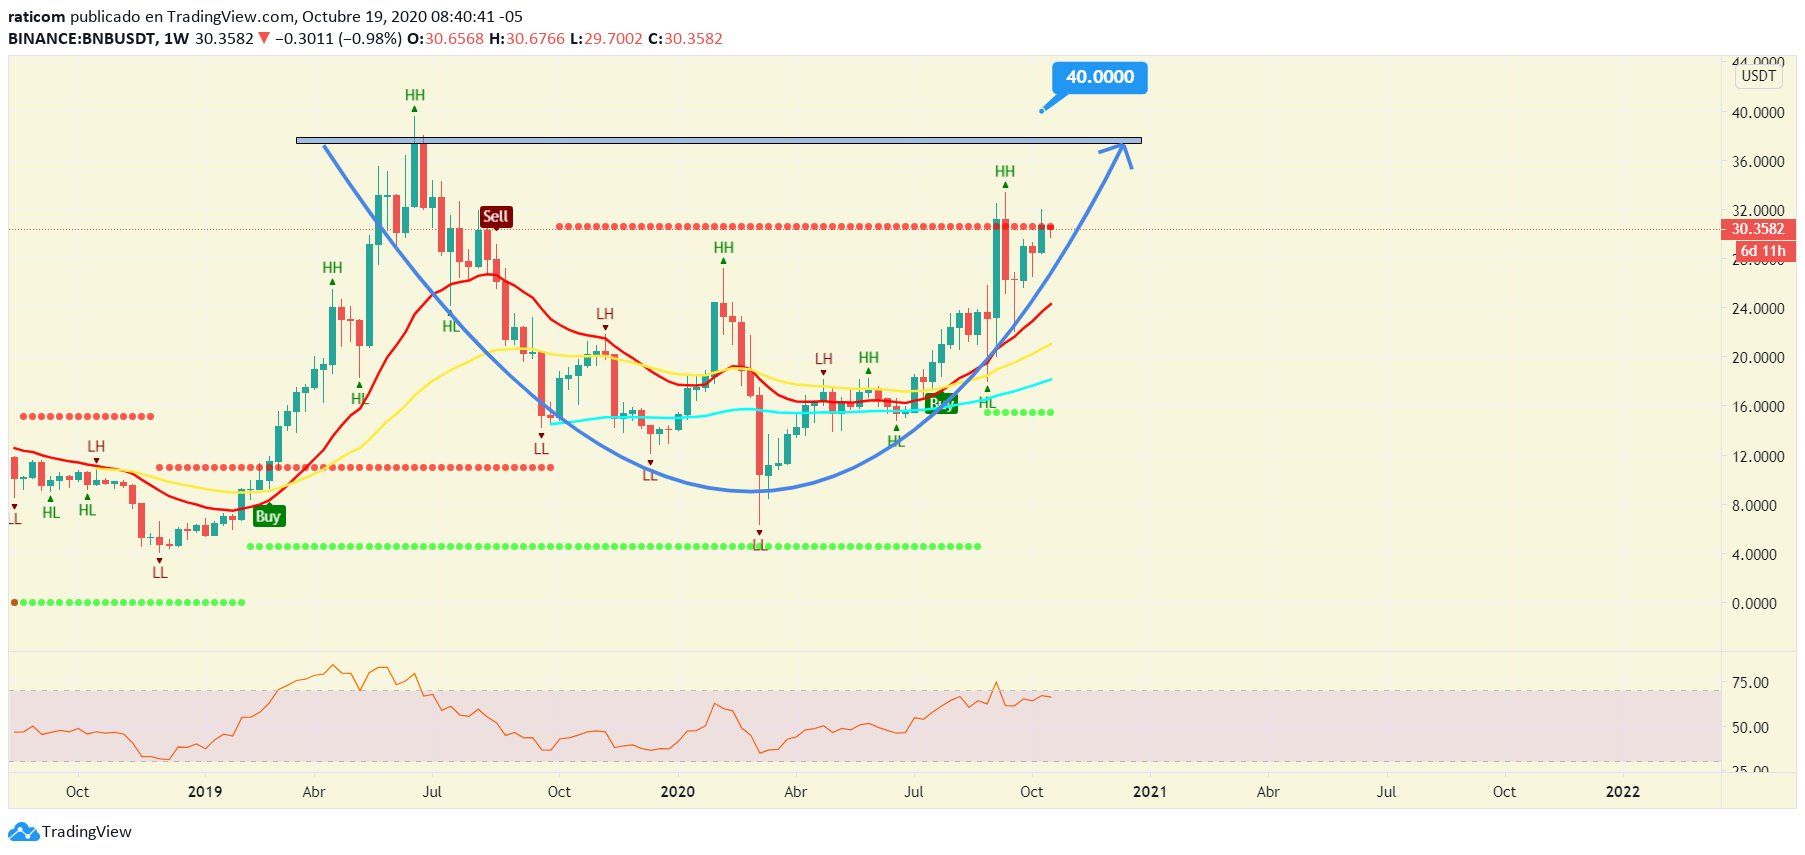
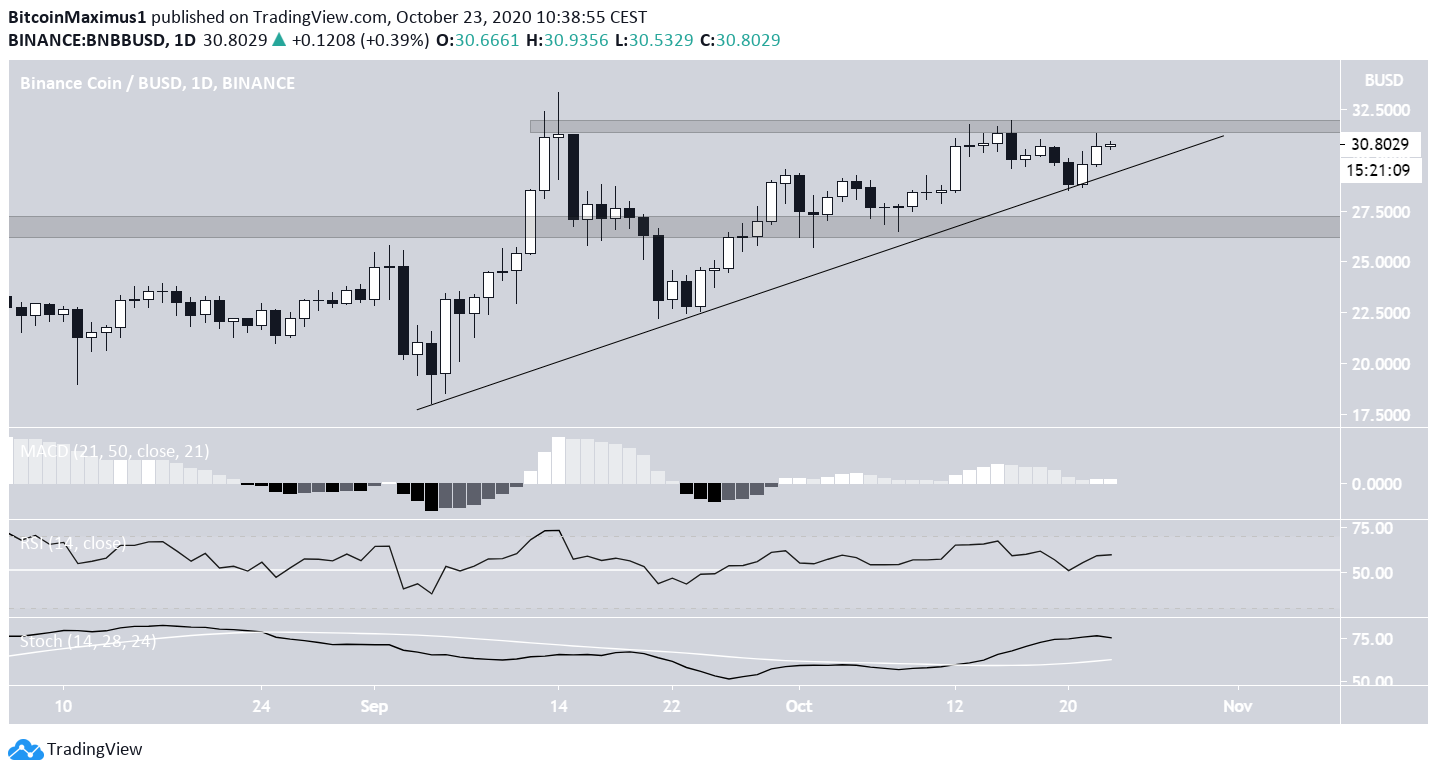
Wave Count
While the long-term count is not entirely clear, it is likely that BNB has completed an A-B-C correction that began on Oct 14 and initiated a bullish impulse afterward. Since the impulse looks completed, a short-term retracement would be expected before the price resumes its upward movement.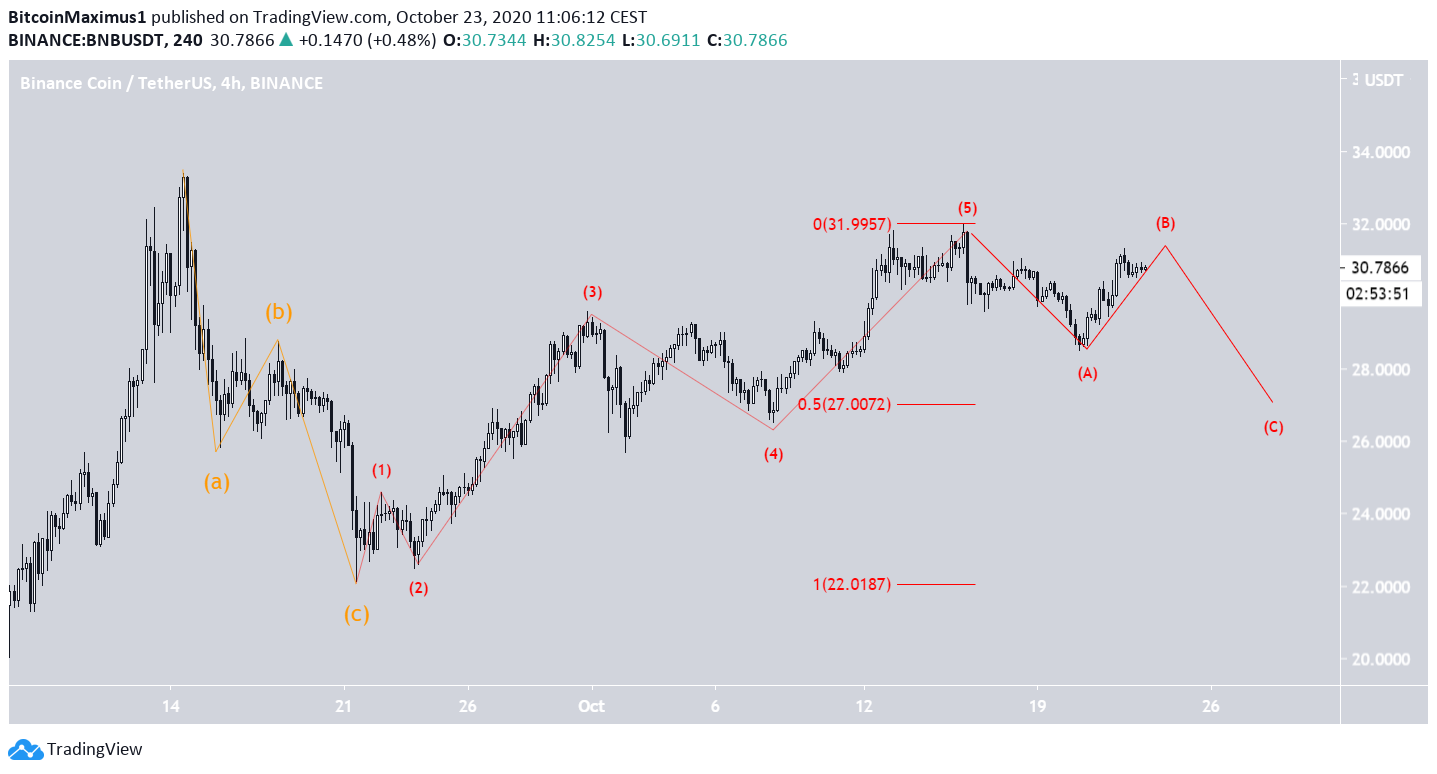
Top crypto projects in the US | April 2024
Trusted
Disclaimer
In line with the Trust Project guidelines, this price analysis article is for informational purposes only and should not be considered financial or investment advice. BeInCrypto is committed to accurate, unbiased reporting, but market conditions are subject to change without notice. Always conduct your own research and consult with a professional before making any financial decisions. Please note that our Terms and Conditions, Privacy Policy, and Disclaimers have been updated.

Valdrin Tahiri
Valdrin discovered cryptocurrencies while he was getting his MSc in Financial Markets from the Barcelona School of Economics. Shortly after graduating, he began writing for several different cryptocurrency related websites as a freelancer before eventually taking on the role of BeInCrypto's Senior Analyst.
(I do not have a discord and will not contact you first there. Beware of scammers)
READ FULL BIO
Sponsored
Sponsored