
This article will take a look at the Basic Attention Token (BAT) and Reserve Rights (RSR) price movement and outline the potential for increases during the month of March.
These two coins are chosen since they both have similar price movement, having just broken out from long-term resistance areas and then validating them as support.
BAT
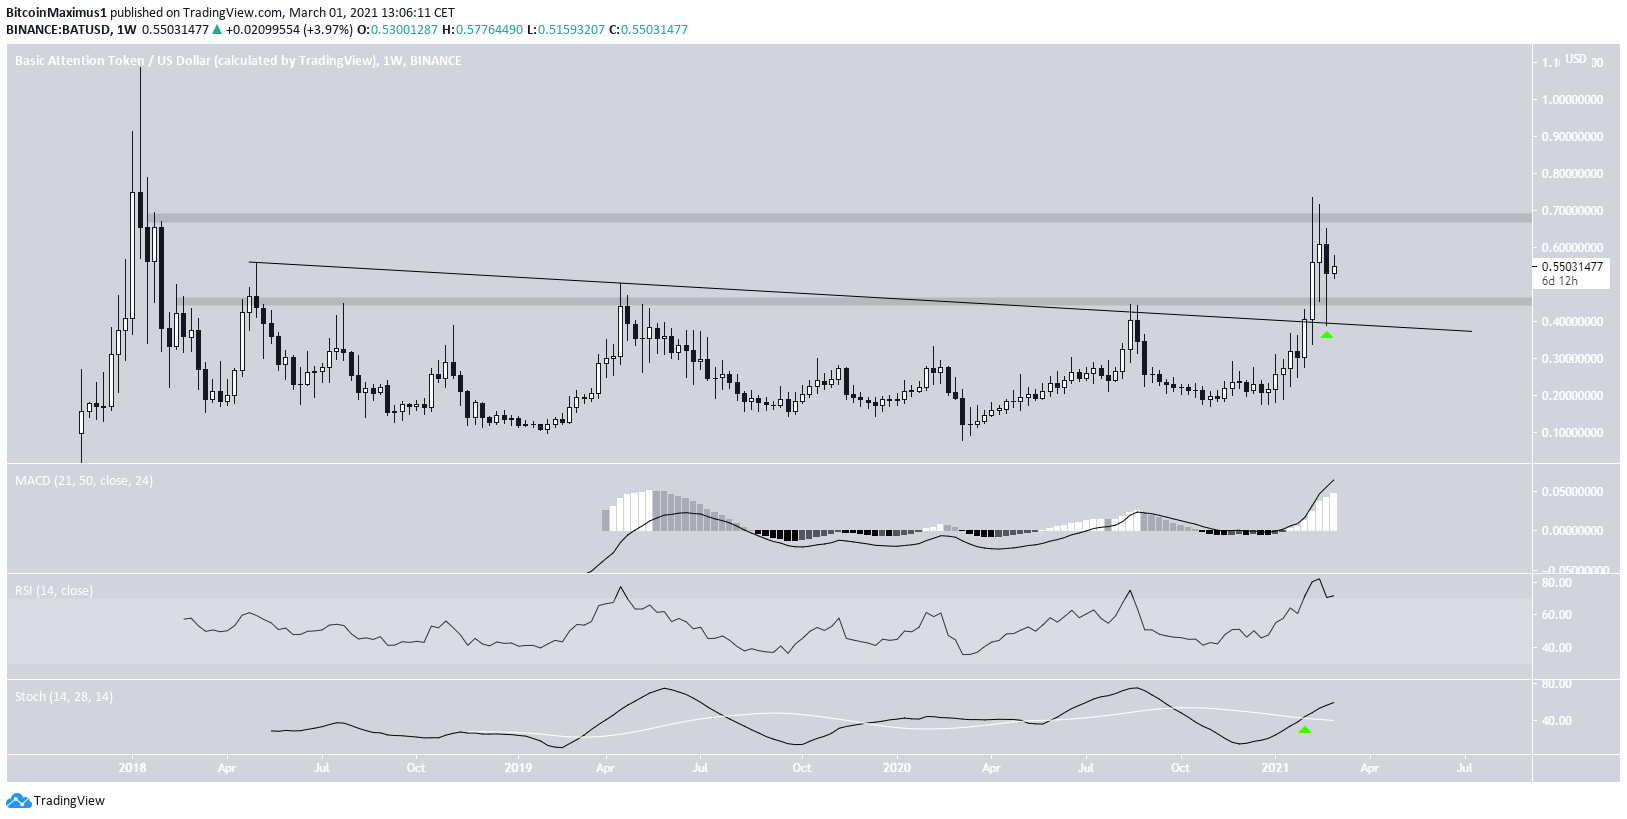
In the beginning of the year, BAT broke out from a long-term descending resistance line that had been in place for more than two years and reclaimed the $0.455 resistance area afterwards. However, BAT was rejected by the $0.68 resistance area, and has been decreasing slightly since.
Currently, it is trading between these two levels.
Technical indicators are bullish, suggesting that BAT will break out above the $0.68 area and potentially make an attempt at reaching a new all-time high price.
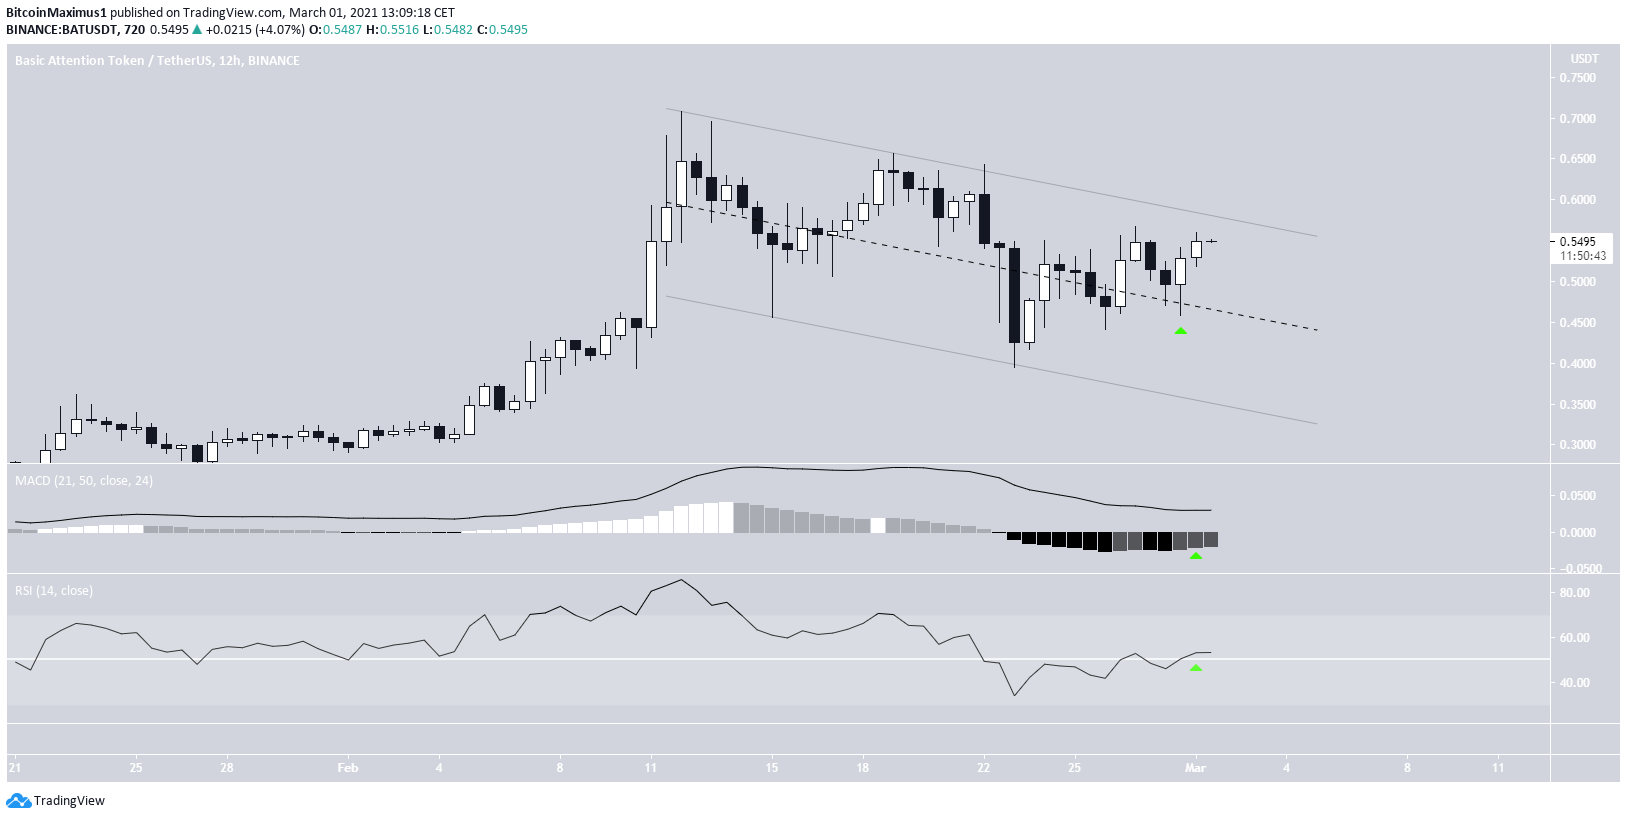
The shorter-term 12-hour chart shows that BAT is trading inside a parallel descending channel, in a movement that is likely to be corrective.
BAT has reclaimed the middle of the channel and increased towards the resistance line, thus a breakout is expected that would take BAT towards the resistance areas previously outlined.
Technical indicators support this possibility.
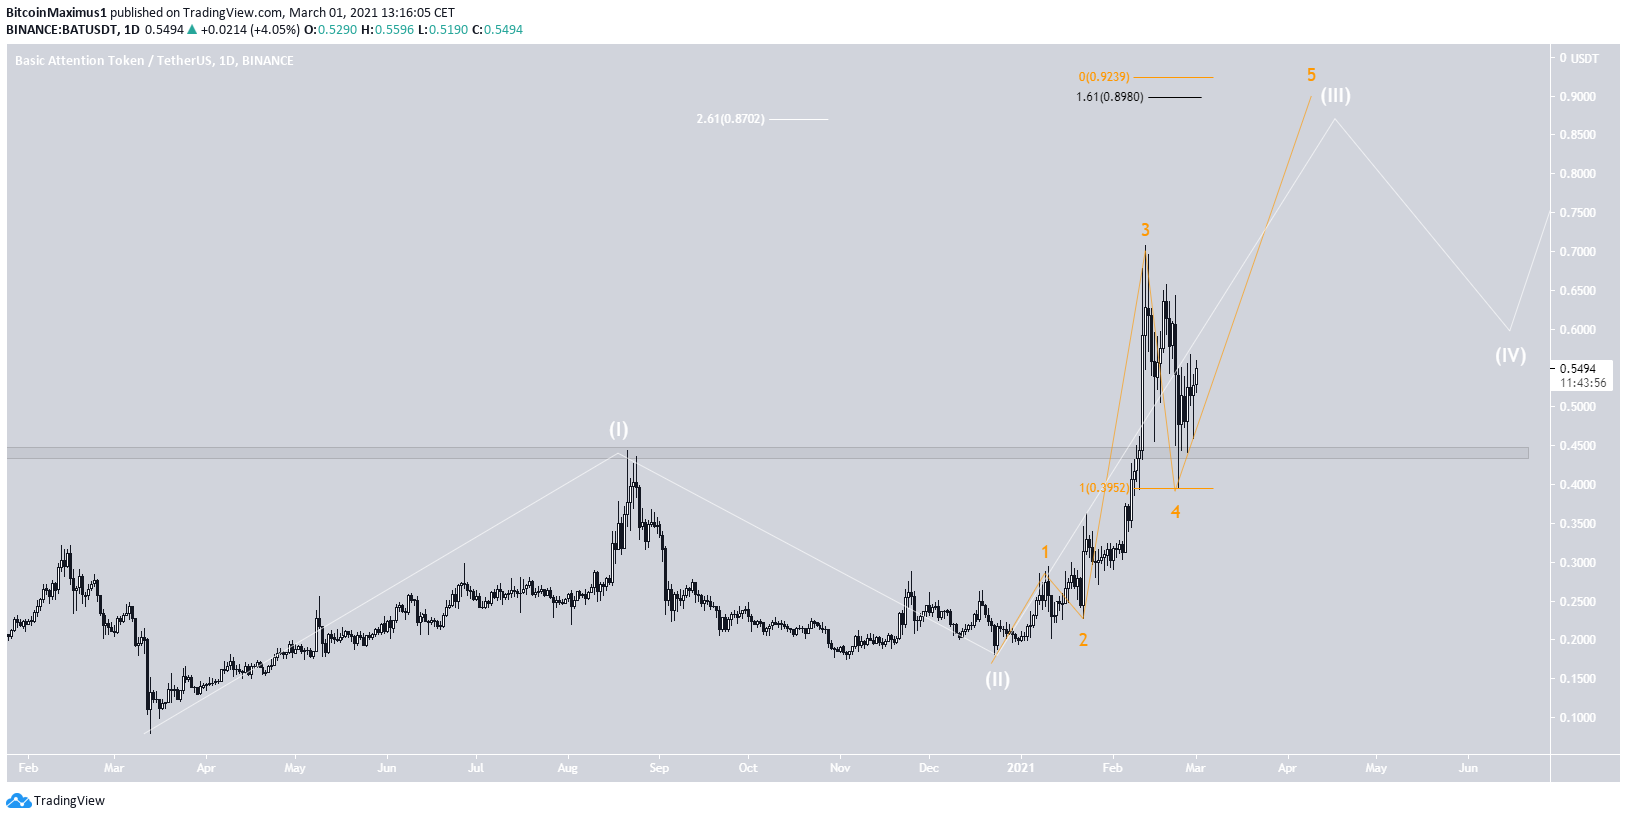
The wave count suggests that BAT is in sub-wave five (orange) of a long-term wave three (white).
The most likely target for the top of this movement is located between $0.87-$0.923, found by using a combination of an external fib retracement (black) and fib projection (orange).
RSR
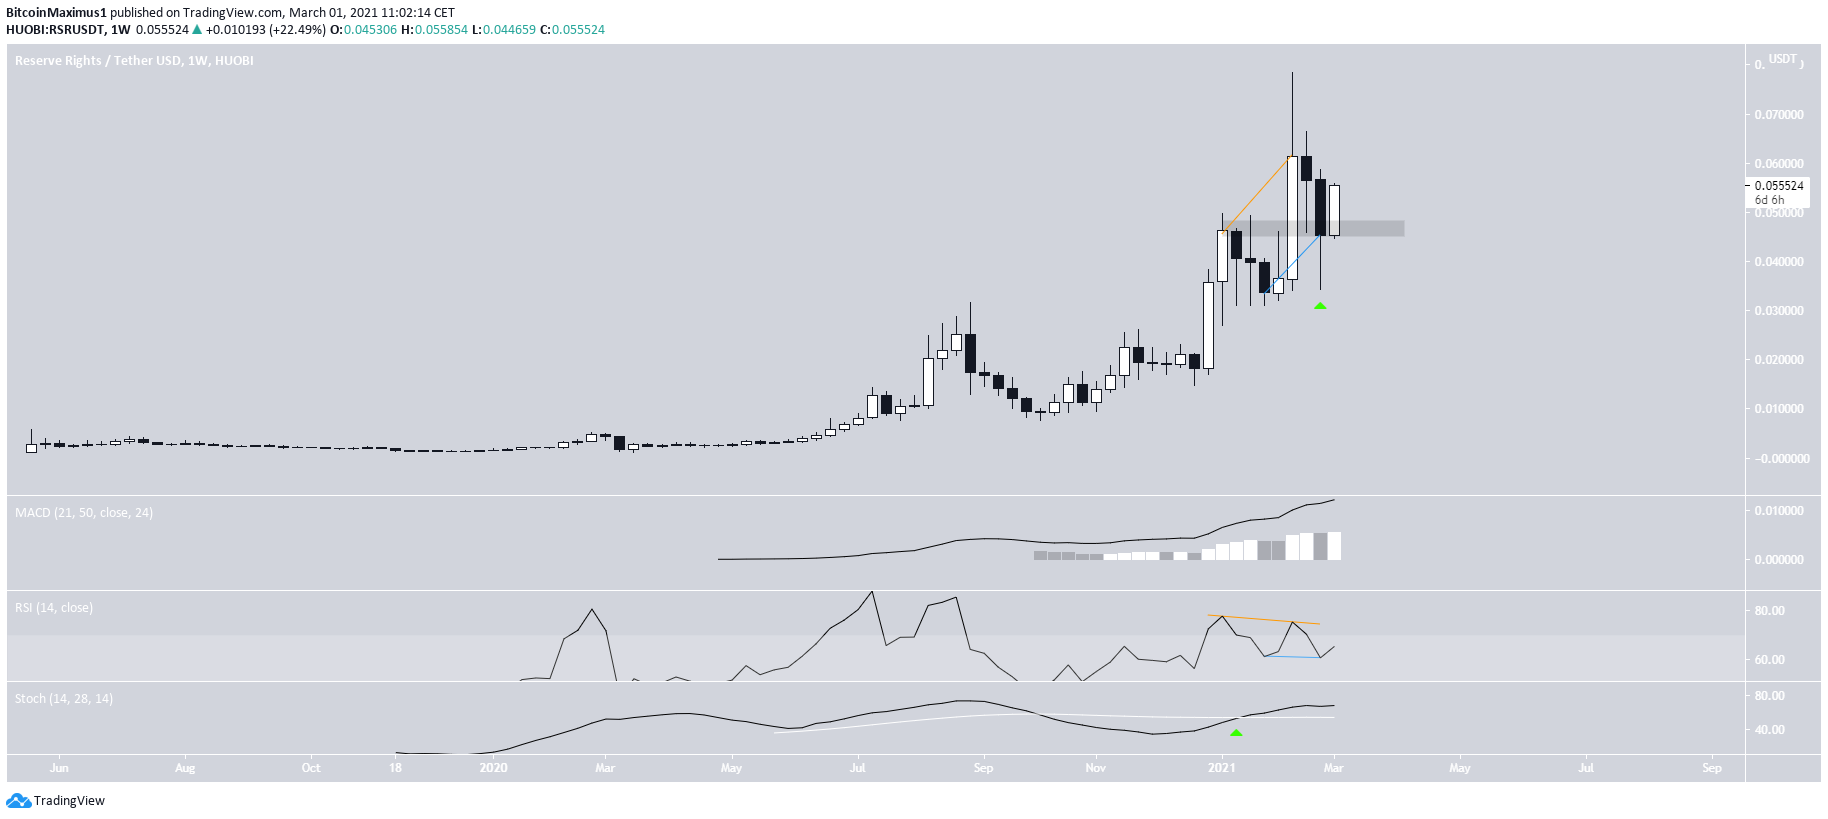
The weekly chart shows that RSR reached an all-time high price of $0.078 on Feb. 14. While the ongoing decrease took it to a low of $0.034 on Feb. 23, RSR created a long lower wick, and has since reclaimed the the $0.047 area, which is now likely to act as support.
While the drop was preceded by bearish divergence in the RSI (orange), it has since generated hidden bullish divergence (blue).
Furthermore, both the RSI and MACD are increasing, indicating that the trend is bullish.
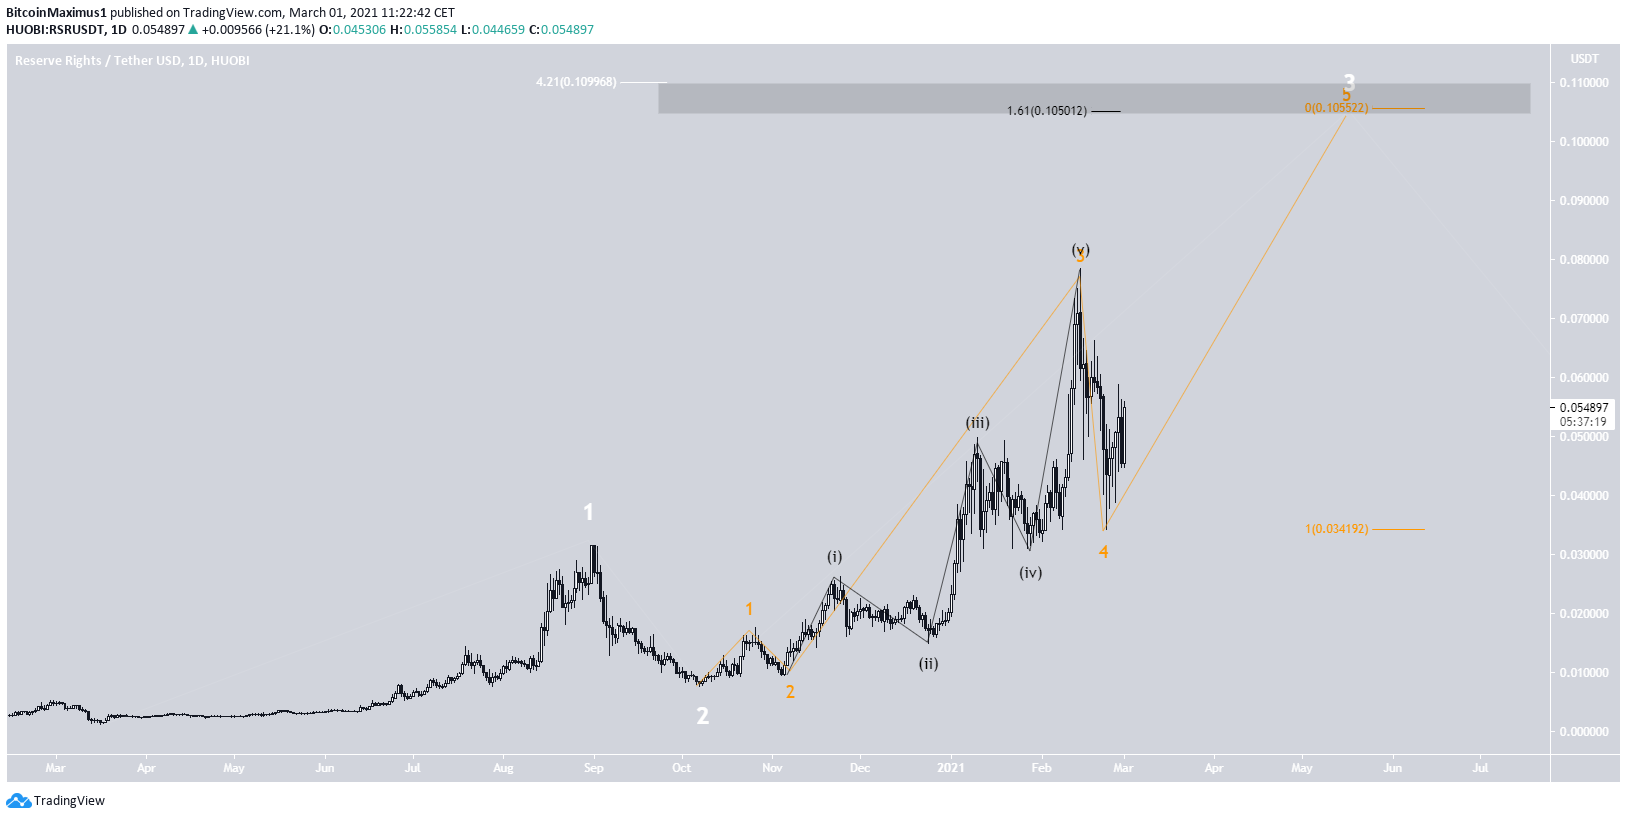
The daily chart supports this outlook, since it clearly shows a deviation below followed by a reclaim of the $0.047 area.
Furthermore, the MACD has given a bullish reversal signal and the RSI has crossed above 50. A bullish cross in the Stochastic oscillator would confirm that the trend is bullish.

The wave count also suggests that RSR is bullish, currently being in sub-wave five (orange) of a long-term wave three (white).
The most likely target for the top of this movement is located between $0.105-$0.0109, found by using a combination of an external fib retracement (black) and fib projection (orange).
Conclusion
To conclude, the outlook for the month of March is bullish for both BAT & RSR is bullish.
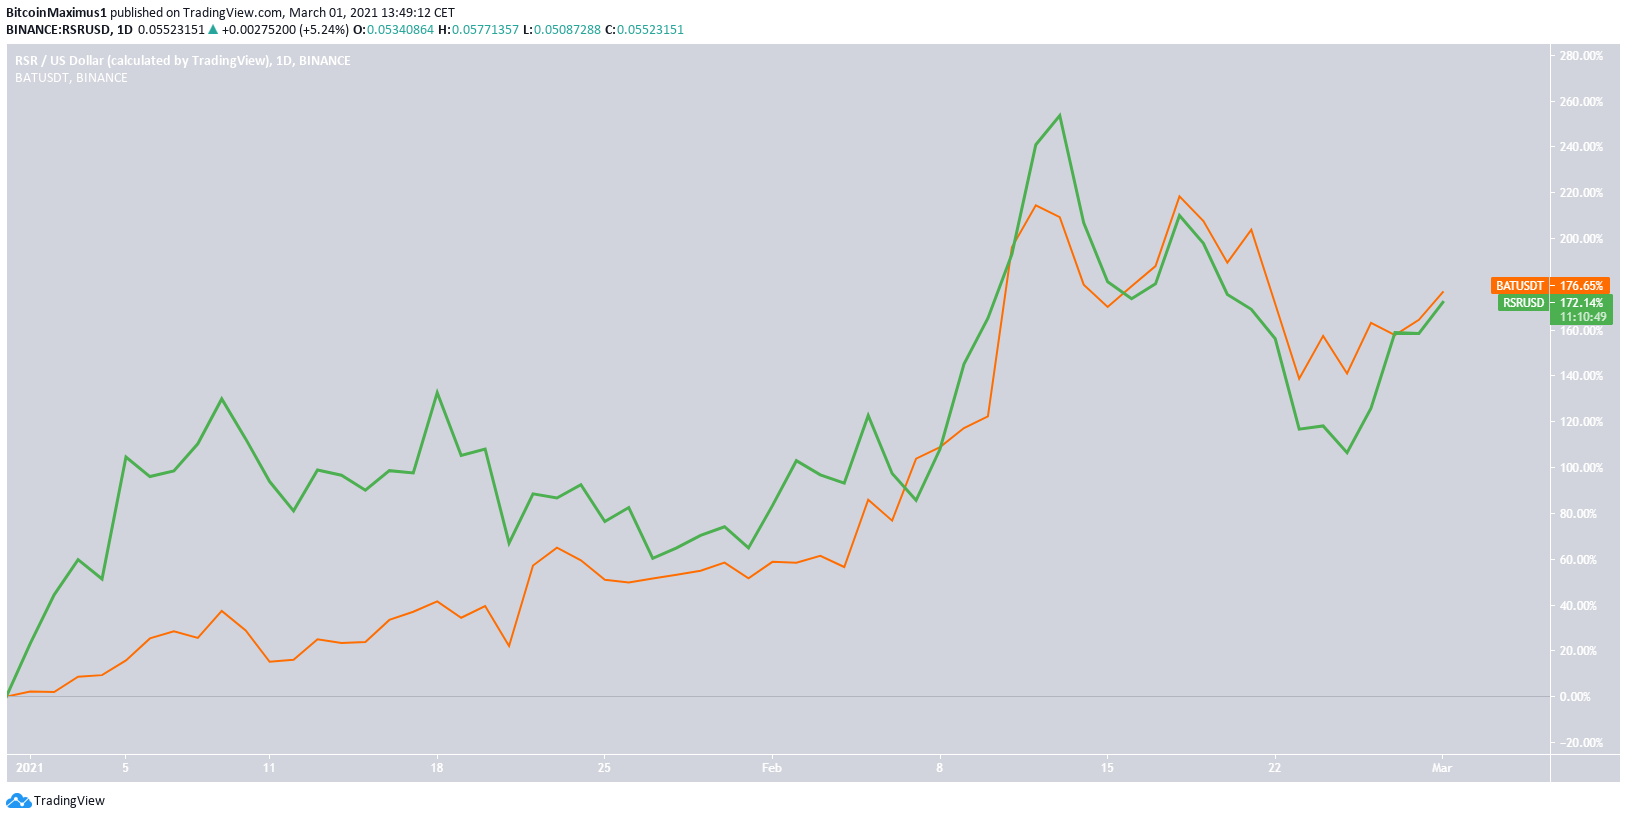
However, the most likely target for the top of the current movement is 65% above the current price for BAT, while 95% for RSR, giving RSR higher potential for gains.
Therefore, while both BAT (orange) and RSR (green) have had a nearly identical rate of increase in 2021, it is possible that RSR will increase at a higher rate for the month of March.
For BeInCrypto’s latest Bitcoin (BTC) analysis, click here.
Trusted
Disclaimer
In line with the Trust Project guidelines, this price analysis article is for informational purposes only and should not be considered financial or investment advice. BeInCrypto is committed to accurate, unbiased reporting, but market conditions are subject to change without notice. Always conduct your own research and consult with a professional before making any financial decisions. Please note that our Terms and Conditions, Privacy Policy, and Disclaimers have been updated.
