At BeInCrypto, we offer regular price analyses and predictions of the most popular and relevant cryptoassets. In this analysis, we take a look at Basic Attention Token (BAT) to predict possible price fluctuations in BAT/USD($).
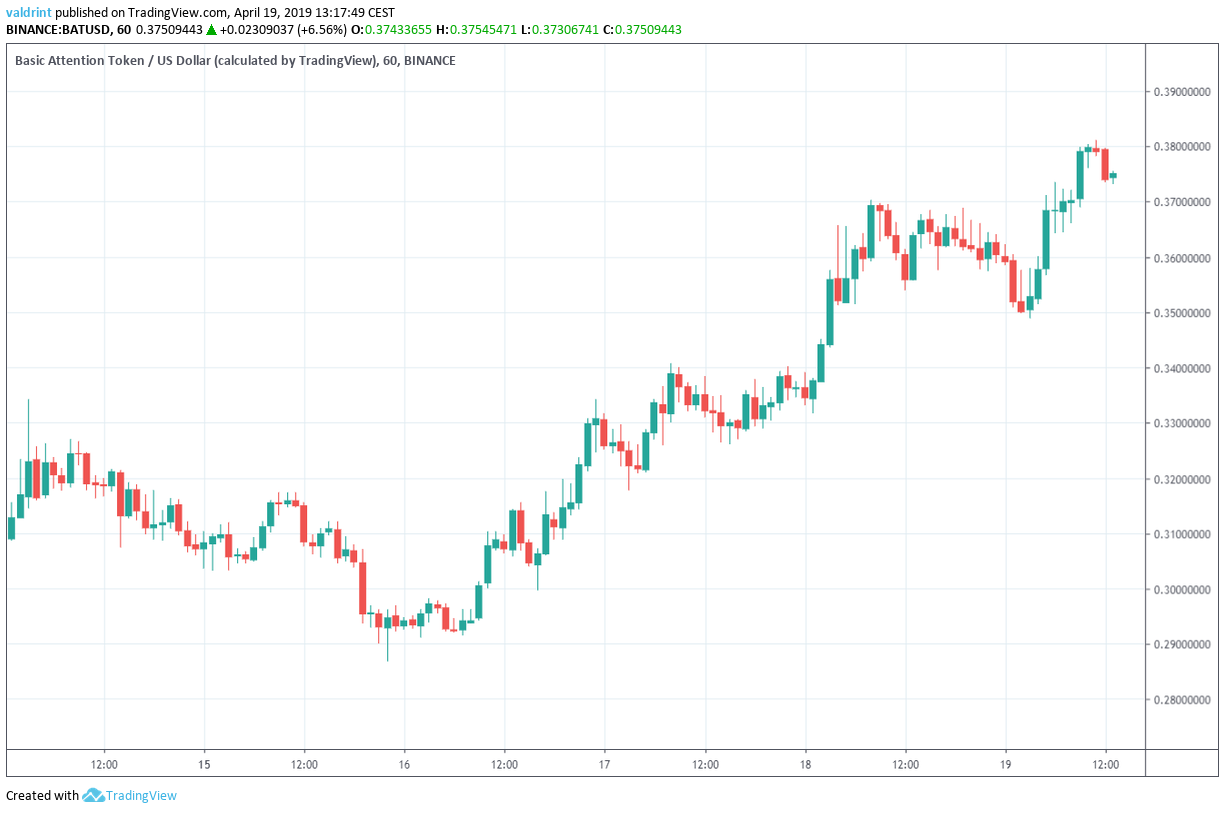
On Apr 14, 2019, the price of BAT reached a high of $0.334. A gradual decrease ensued and the price reached a low of $0.286 on Apr 15.
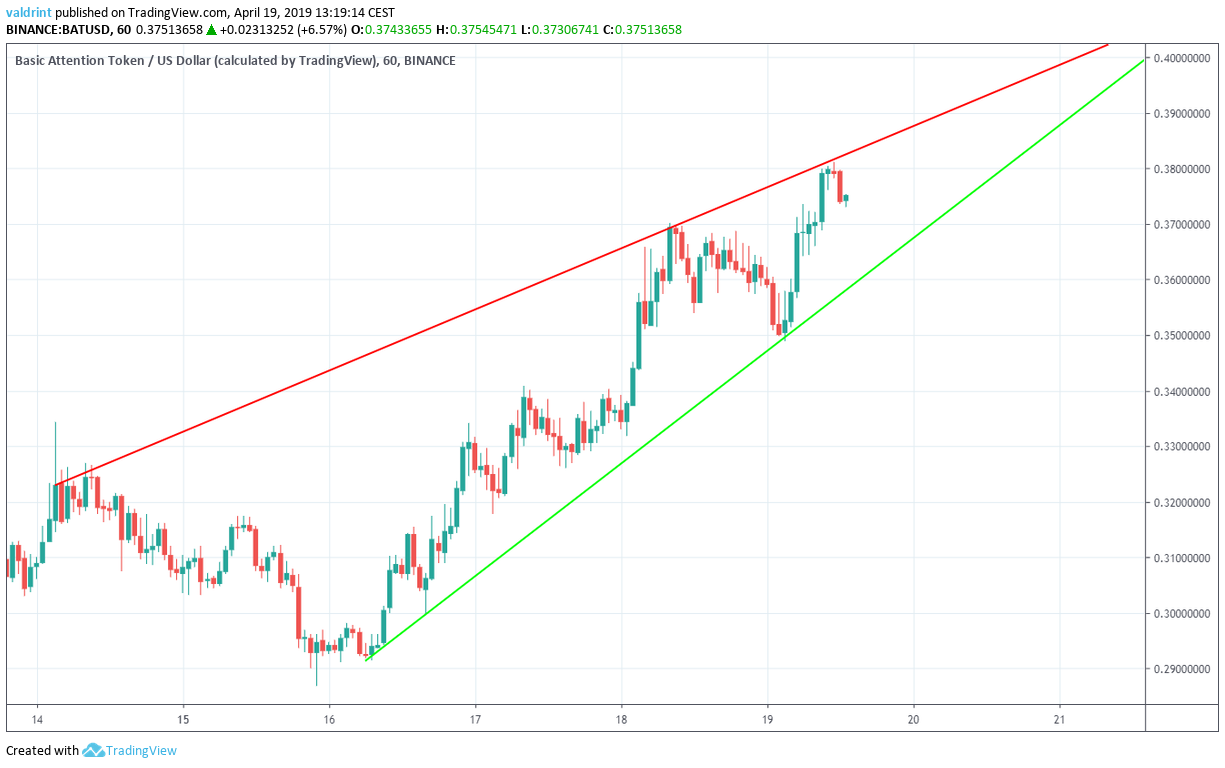
Basic Attention Token (BAT) Prices: Apr 14 – Apr 19
Since Apr 15, the price of BAT has been increasing. At the time of writing, the highest price recorded was $0.381 reached on Apr 19.
Has a top been reached or can we expect further price gains before a reversal?
Let’s find out:
Basic Attention Token (BAT): Trends And Highlights For April 19, 2019
BAT/USD reached a high of $0.381 on Apr 19.
It appears to be trading inside an ascending wedge.
Bearish divergence is developing in the RSI and the MACD.
There is support near $0.33.
Tracing the Current Trading Pattern
The price of BAT/USD on Binance was analyzed at one-hour intervals from Apr 14 to Apr 19 to trace the current trading pattern.
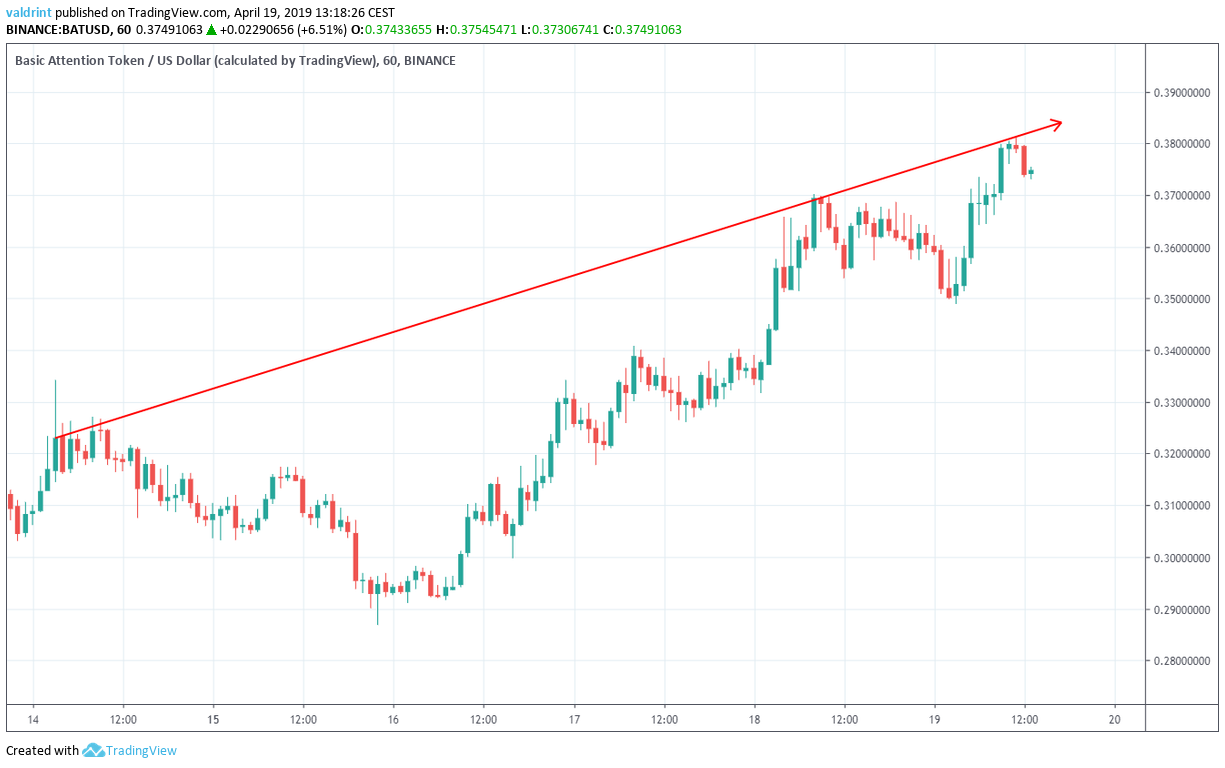
On Apr 14, the price made a high of $0.334. Since then, it has been increasing, creating several higher highs.
Tracing these highs gives us an ascending resistance line:
On Apr 16, the price reached a low of $0.291. Several market cycles have been completed and the price has made several higher lows.
Tracing these lows gives us an ascending support line.
The resistance and support lines combine to create an ascending wedge:
It is likely that the price will continue trading inside the confines of this wedge until a decisive move occurs.
In order to figure out the direction of the move, we need to incorporate technical indicators.
Technical Indicators
In this section, we incorporate RSI and MACD in an attempt to predict future short-term price fluctuations.
The relative strength index (RSI) is an indicator which calculates the size of the changes in price in order to determine oversold or overbought conditions in the market.
The moving average convergence divergence (MACD) is a trend indicator that shows the relationship between two moving averages (long and short-term) and the price
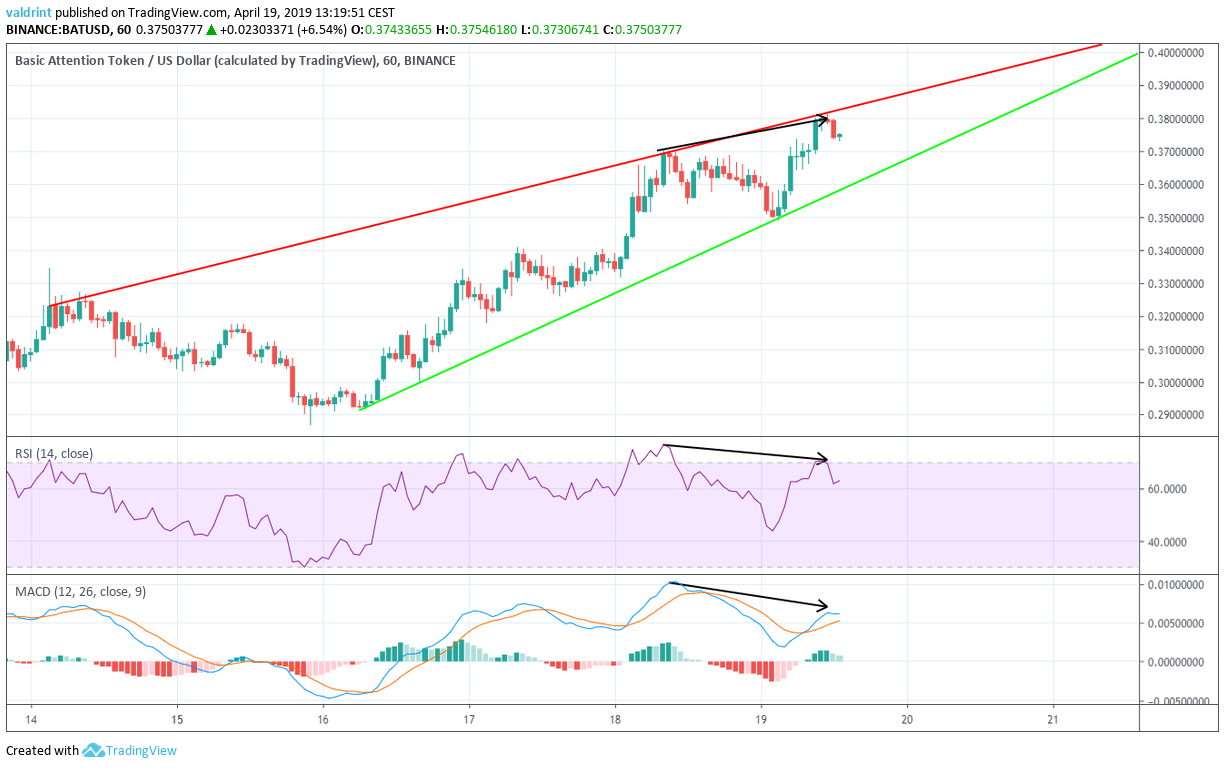
Combining RSI and MACD bullish/bearish divergence with support/resistance essentially predicts price fluctuations. Both are traced below price in the graph below:
On Apr 18, the price reached a high of $0.370. It continued to increase and on Apr 19 reached a high of $0.381.
Similarly, the RSI and the MACD made the first high on Apr 18. However, they have continued to generate lower values.
This is known as bearish divergence and often precedes price decreases. Furthermore, the divergence is significant and is occurring at the resistance line of a bearish pattern.
The use of these indicators makes it likely that the price drops to the support line of the wedge. A breakdown is possible.
Future Movement
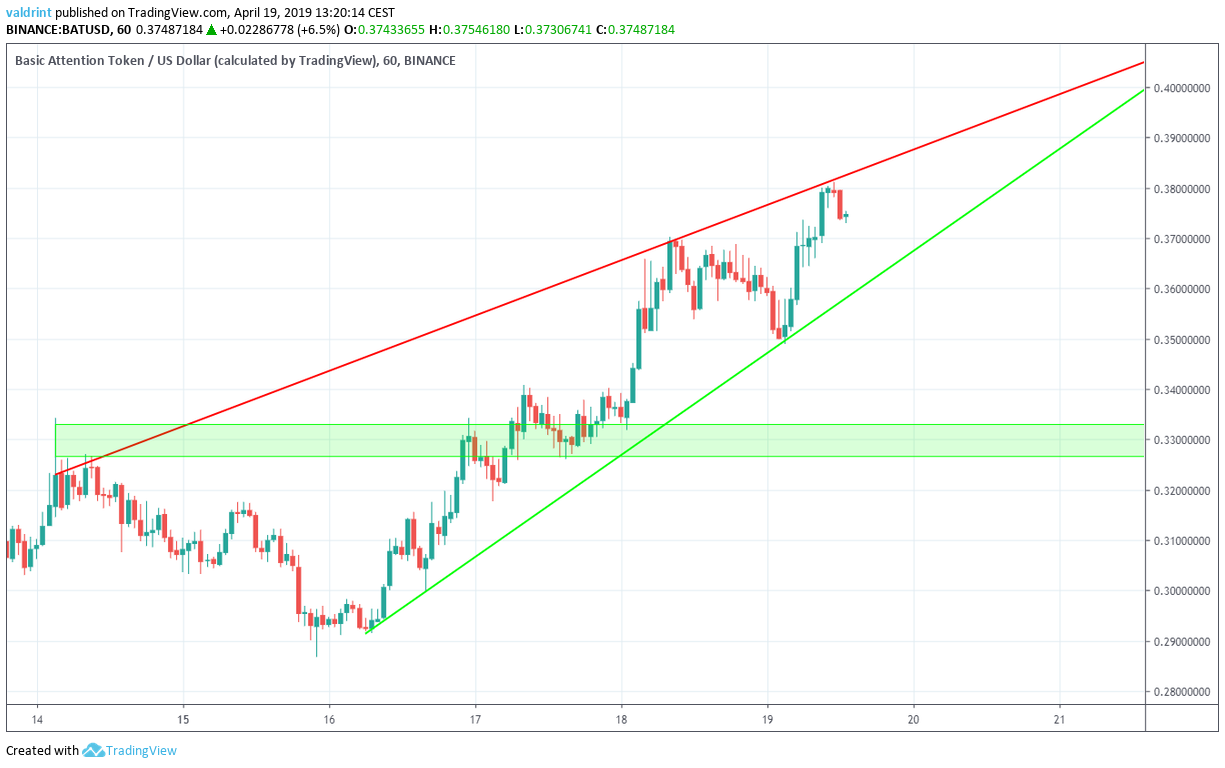
In this section, we incorporate support areas into the analysis to determine possible future price levels.
Support areas are created when the price reaches a certain level numerous times. They can act as a reversal area in case a breakdown or breakout occurs.
One support area is shown in the graph below:
The closest support area is found near $0.33. If the price breaks down from the wedge, it is likely to provide a reversal. We believe that price will breakdown and likely move toward this area.
Summary of Analysis
Based on our analysis, it is likely that the price of BAT will keep trading inside the confines of the wedge until a breakdown occurs. Prices as low as $0.33 appear possible.
Do you think the price of BAT will break down from the wedge? Let us know your thoughts in the comments below!
Interested in 2019, 2020, and 5 year Bitcoin price predictions? Click on the green button below:
Disclaimer: This article is not trading advice and should not be construed as such. Always consult a trained financial professional before investing in cryptocurrencies, as the market is particularly volatile.
In line with the Trust Project guidelines, this price analysis article is for informational purposes only and should not be considered financial or investment advice. BeInCrypto is committed to accurate, unbiased reporting, but market conditions are subject to change without notice. Always conduct your own research and consult with a professional before making any financial decisions. Please note that our Terms and Conditions, Privacy Policy, and Disclaimers have been updated.
Valdrin discovered cryptocurrencies while he was getting his MSc in Financial Markets from the Barcelona School of Economics. Shortly after graduating, he began writing for several different cryptocurrency related websites as a freelancer before eventually taking on the role of BeInCrypto's Senior Analyst.
(I do not have a discord and will not contact you first there. Beware of scammers)

 On Apr 16, the price reached a low of $0.291. Several market cycles have been completed and the price has made several higher lows.
Tracing these lows gives us an ascending support line.
The resistance and support lines combine to create an ascending wedge:
On Apr 16, the price reached a low of $0.291. Several market cycles have been completed and the price has made several higher lows.
Tracing these lows gives us an ascending support line.
The resistance and support lines combine to create an ascending wedge:
 It is likely that the price will continue trading inside the confines of this wedge until a decisive move occurs.
In order to figure out the direction of the move, we need to incorporate technical indicators.
It is likely that the price will continue trading inside the confines of this wedge until a decisive move occurs.
In order to figure out the direction of the move, we need to incorporate technical indicators.