

Cosmos (ATOM) has bounced at an important Fib retracement level, but its movement is devoid of any trading structure.
Reserve Rights (RSR) has fallen below the $0.048 support area, and it needs to reclaim this for the trend to remain bullish.
NANO (NANO) has retraced to the previous breakout level at $5 and is in the process of bouncing.
Cosmos (ATOM)
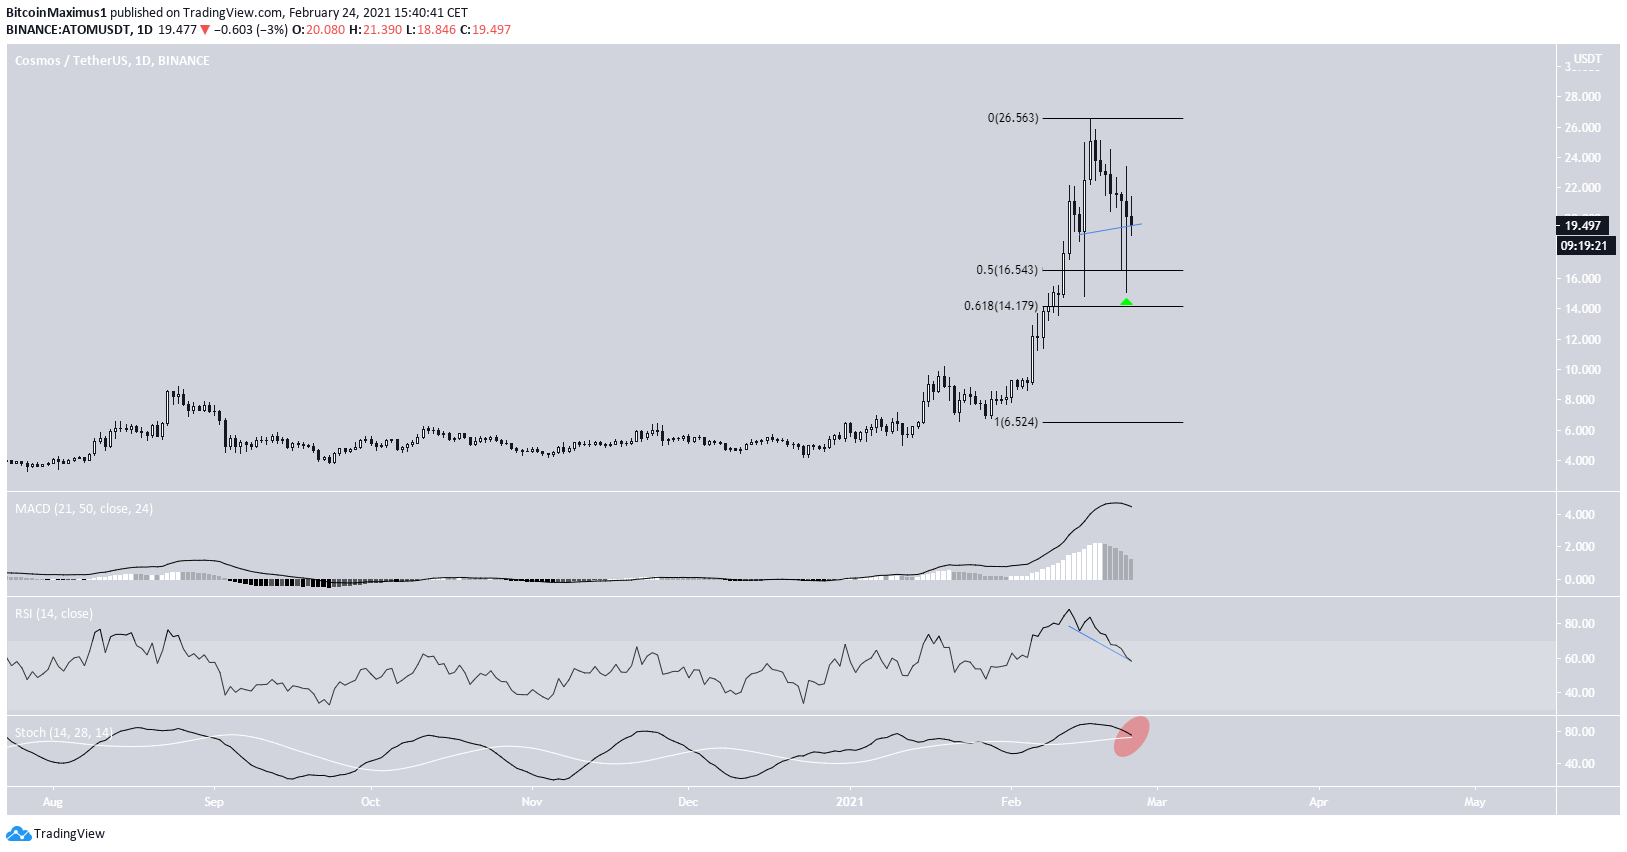
ATOM has been falling since it reached a high of $26.50 on Feb. 16. The decline accelerated on Feb. 22, and ATOM reached a low of $15.10 the next day.
However, ATOM has bounced since the low, creating a very long lower wick. The bounce occurred right at the 0.5 Fib retracement level at $16.50, an area likely to act as support.
However, the direction of the trend is unclear due to conflicting signs from technical indicators. While the RSI has crossed below 70, it has also formed hidden bullish divergence. The MACD is still positive, but the Stochastic oscillator is very close to making a bearish cross.
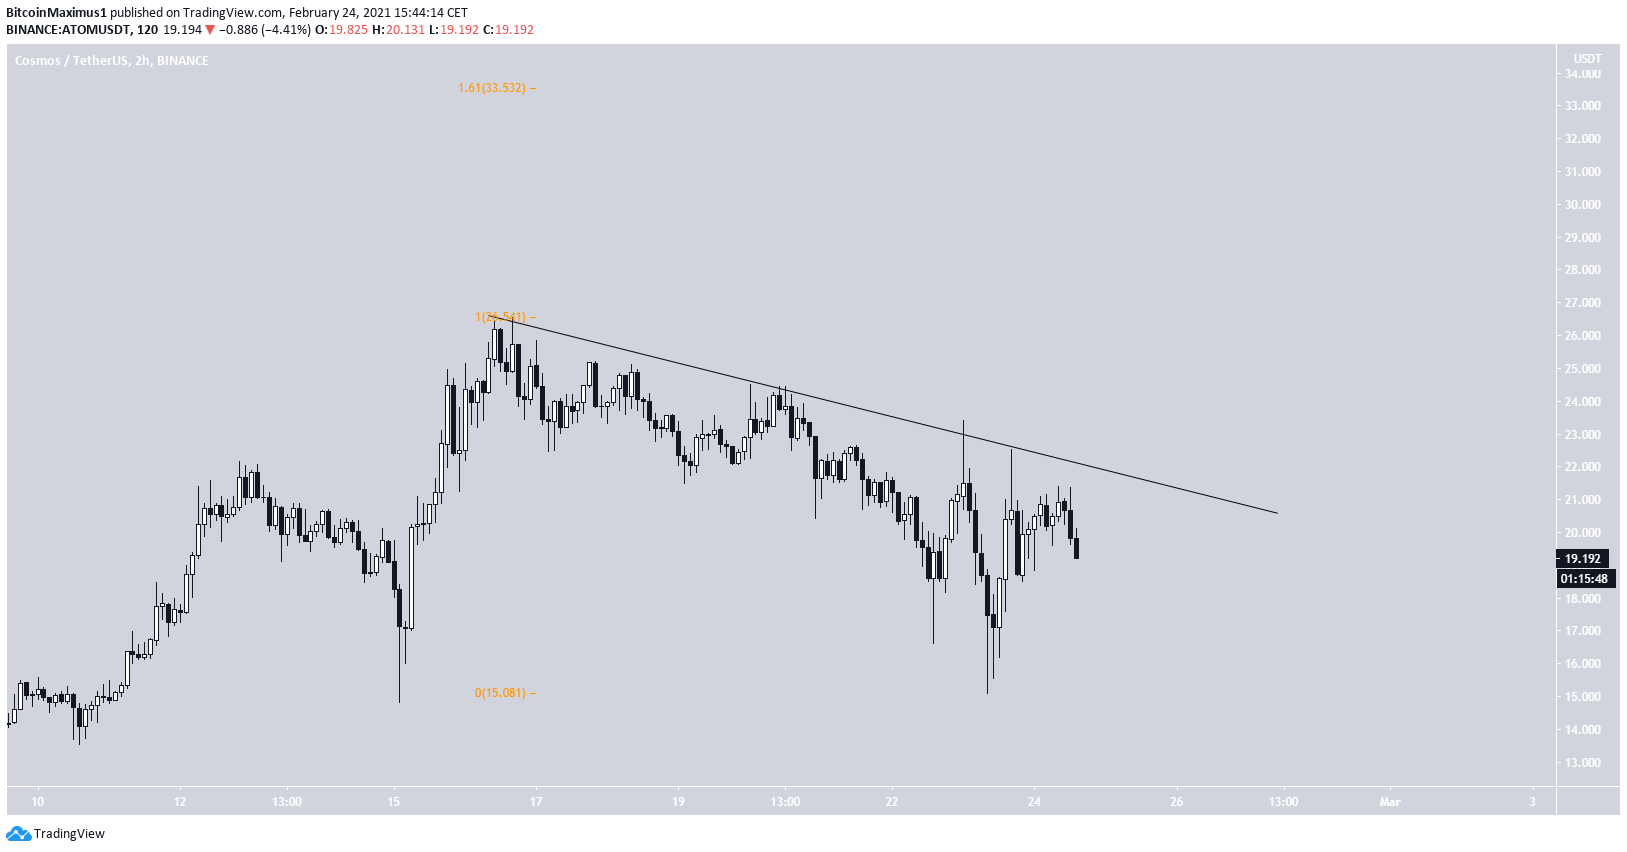
The shorter-term chart shows that ATOM is still following a descending resistance line. The trend is bearish until it breaks out from here.
Since ATOM is at an all-time high, the use of an external fib retracement is required to determine the top of the ensuing movement if ATOM were to break out. Doing that gives us a potential target of $33.
Highlights
- ATOM is following a descending resistance line
- There is support at $16.50.
Reserve Rights (RSR)
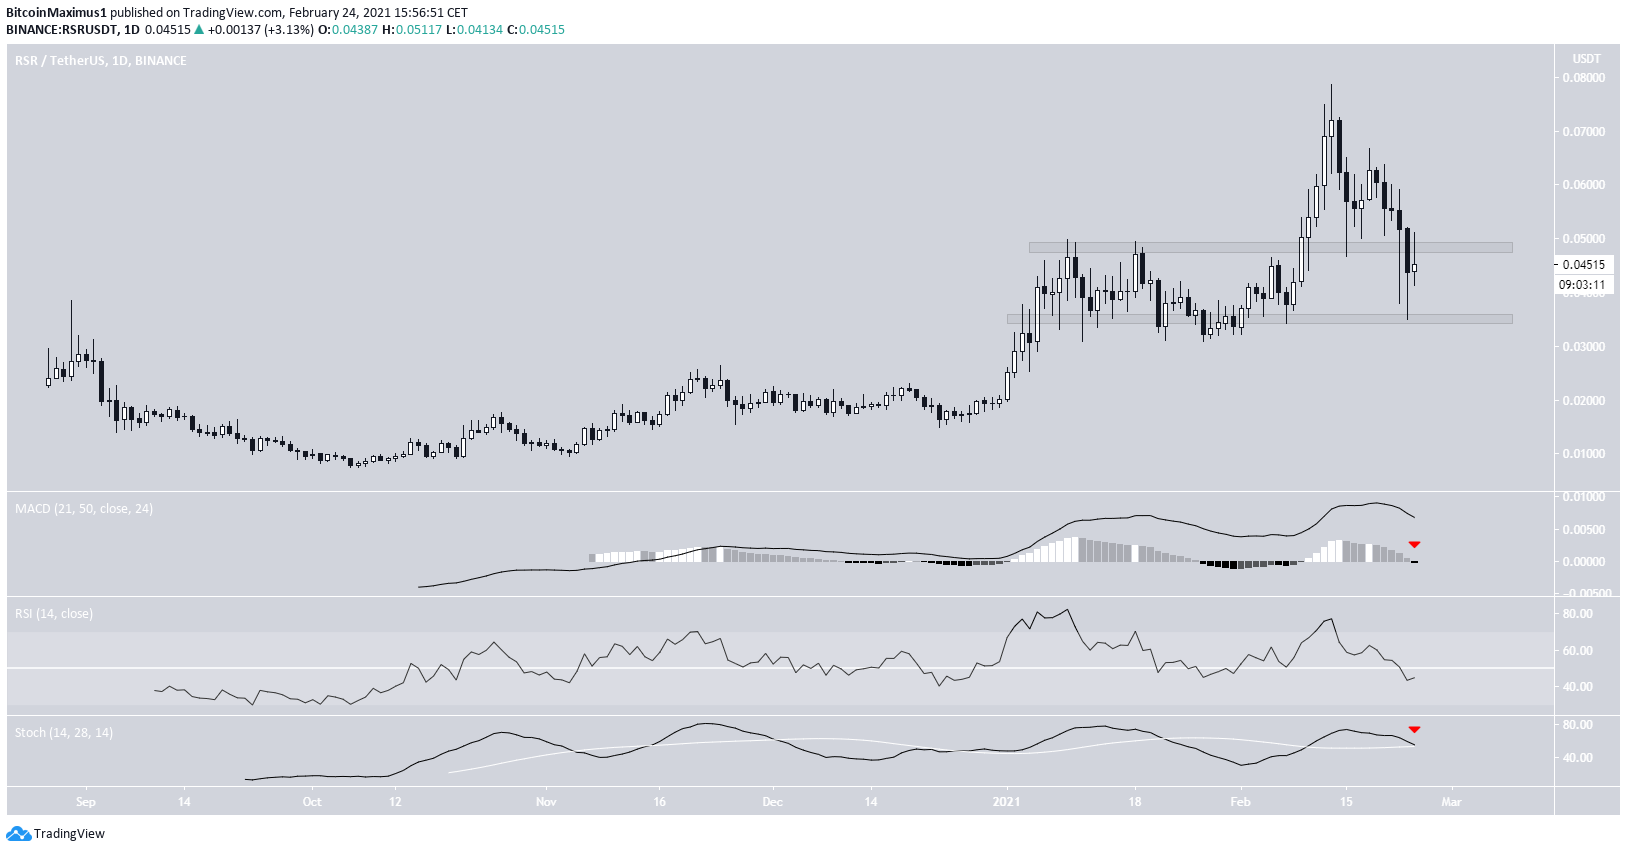
The daily chart shows that RSR has been declining since it reached a high of $0.078 on Feb. 13.
RSR has failed to bounce at the $0.048 area, which previously acted as resistance and was likely to act as support. On the contrary, RSR fell all the way to the next support at $0.035 before bouncing. The reclaim of the $0.048 handle is mandatory for the trend to turn bullish.
However, technical indicators are bearish, as evidenced by the RSI cross below 50, the bearish MACD histogram, and the potential bearish cross in the Stochastic oscillator.
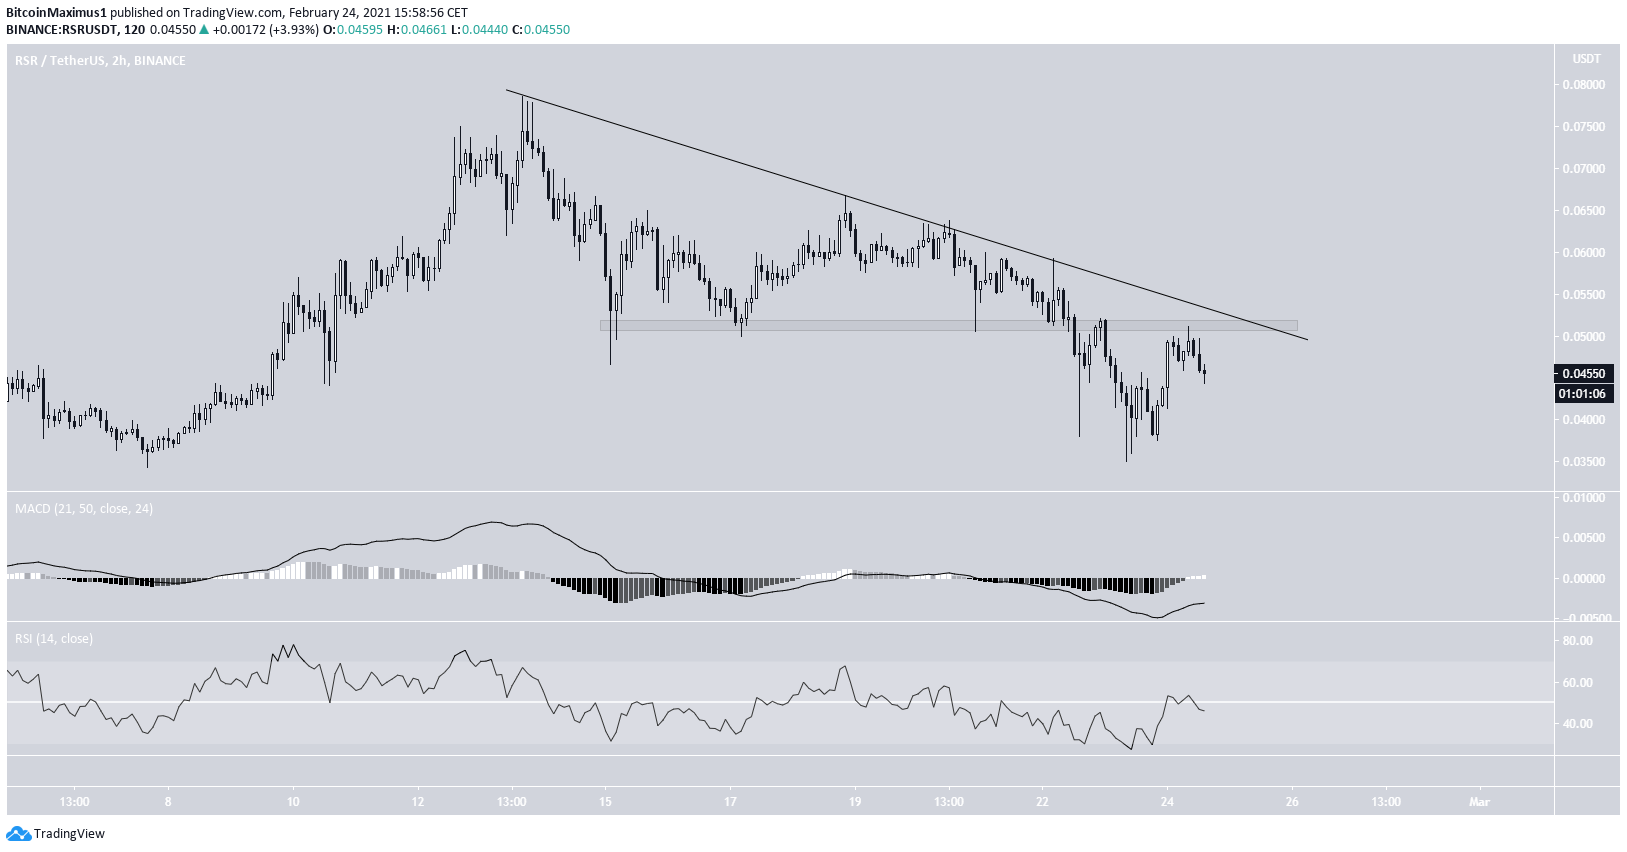
The shorter-term chart shows that RSR is also following a descending resistance line, which coincides with the $0.054 minor resistance area.
Despite bullish technical indicators, the trend is bearish until RSR manages to break out above this line.
Highlights
- RSR has fallen below the $0.048 area.
- RSR is following a descending resistance line.
Nano (NANO)
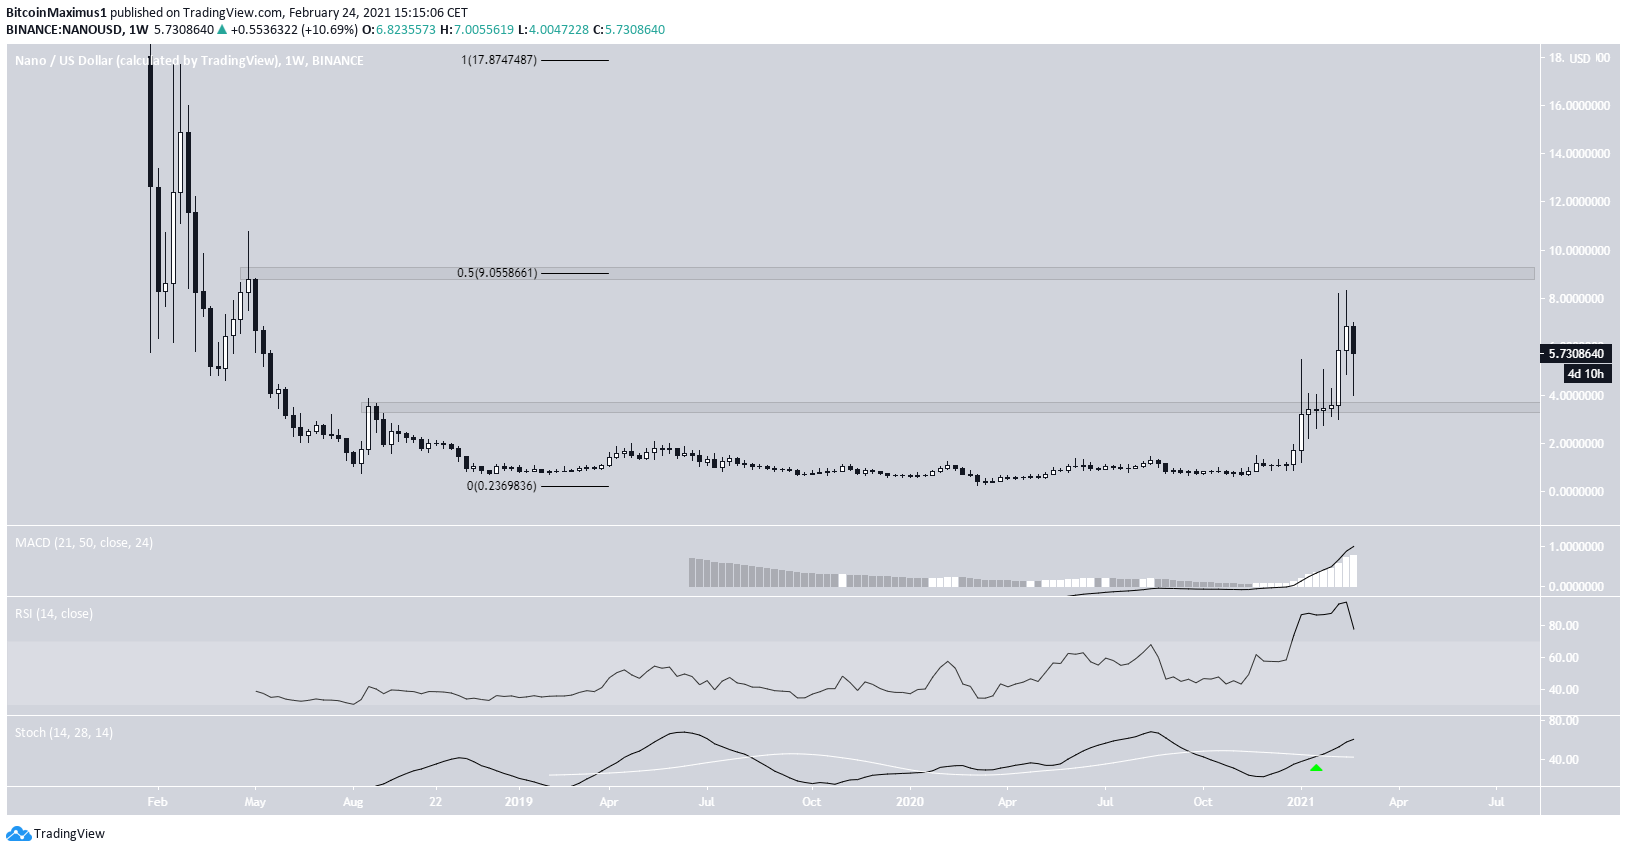
The weekly chart shows that NANO is trading inside a long-term range between $3.50 and $9, having done so since Mar. 2018.
After breaking out from the $3.50 resistance area at the beginning of the year, NANO resumed its upward move but failed to reach the $9 resistance area and has been decreasing throughout the week.
Despite the setback, technical indicators are still bullish, as evidenced by the bullish cross in the Stochastic oscillator, supporting the upward movement.
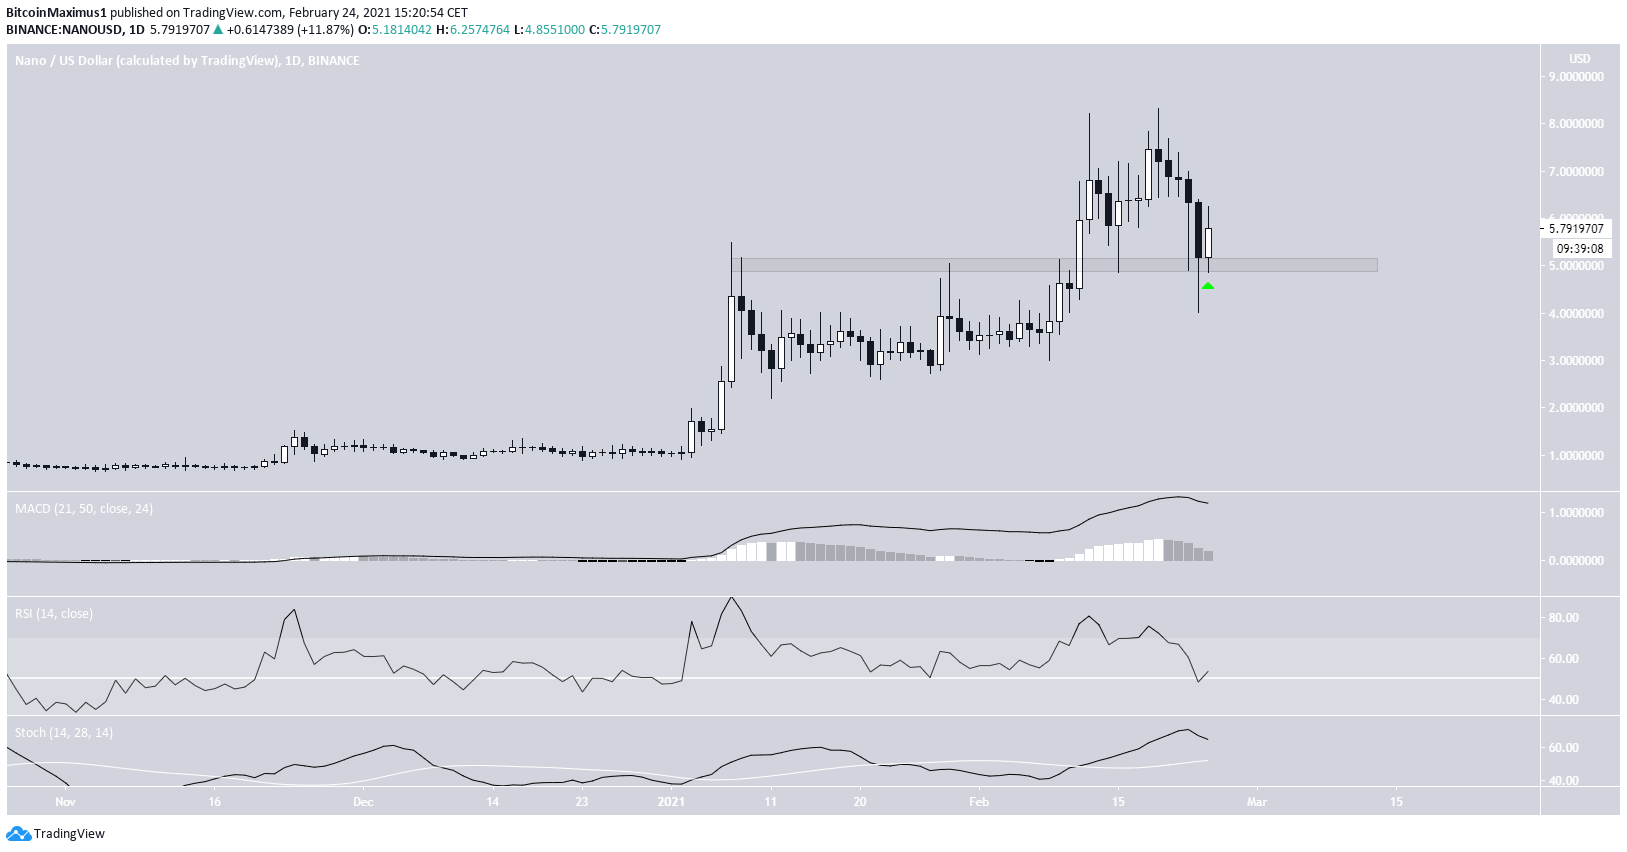
The outlook from the daily time-frame aligns with that of the weekly.
NANO has returned to validate the $5 area after previously breaking out above it. As long as NANO is trading above this level, it should continue moving upwards and gradually reach the previously outlined resistance area at $9.
While indicators show a loss of strength, they are still bullish.
Highlights
- NANO has bounced at the $5 support area.
- Weekly and daily technical indicators are bullish.
For BeInCrypto’s latest Bitcoin (BTC) analysis, click here.
Trusted
Disclaimer
In line with the Trust Project guidelines, this price analysis article is for informational purposes only and should not be considered financial or investment advice. BeInCrypto is committed to accurate, unbiased reporting, but market conditions are subject to change without notice. Always conduct your own research and consult with a professional before making any financial decisions. Please note that our Terms and Conditions, Privacy Policy, and Disclaimers have been updated.
