

Ankr (ANKR) seems to have begun a bullish reversal on Feb. 24 by creating a bullish hammer candlestick.
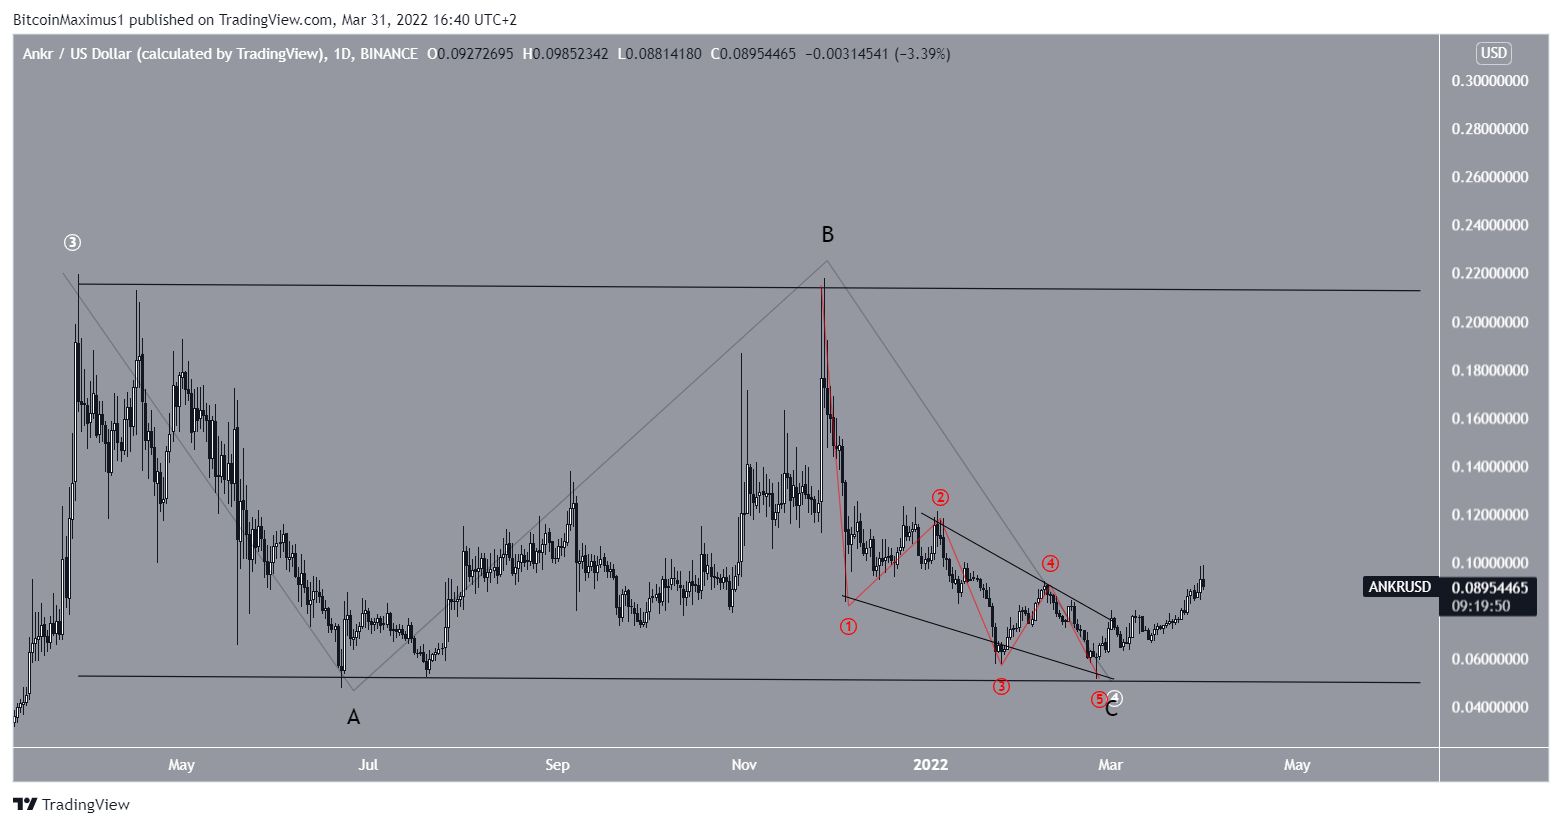
ANKR has been decreasing since reaching an all-time high $0.21 on March 28, 2021. The price regained its footing in July and nearly reached a new all-time high on Nov 27.
However, it fell slightly short and initiated yet another downward movement, which led to a low of $0.051 on Feb. 24 (green icon).
The entire movement since April has seemingly been contained inside a descending parallel channel. Such channels are considered corrective movements, meaning that an eventual breakout from it would be the most likely scenario.
For now, the main resistance area seems to be at $0.132. This is the 0.5 Fib retracement resistance level and the middle of the channel.

Ongoing ANKR increase
A closer look at the movement shows that ANKR created a bullish hammer candlestick on Feb. 24. This is a type of bullish candlestick with a long lower wick and a bullish close. It occurs as a result of intense buying pressure which did not allow prices to fall.
Furthermore, the low was combined with bullish divergence in both the RSI and MACD (green lines). Such divergences often precedes bullish trend reversals.
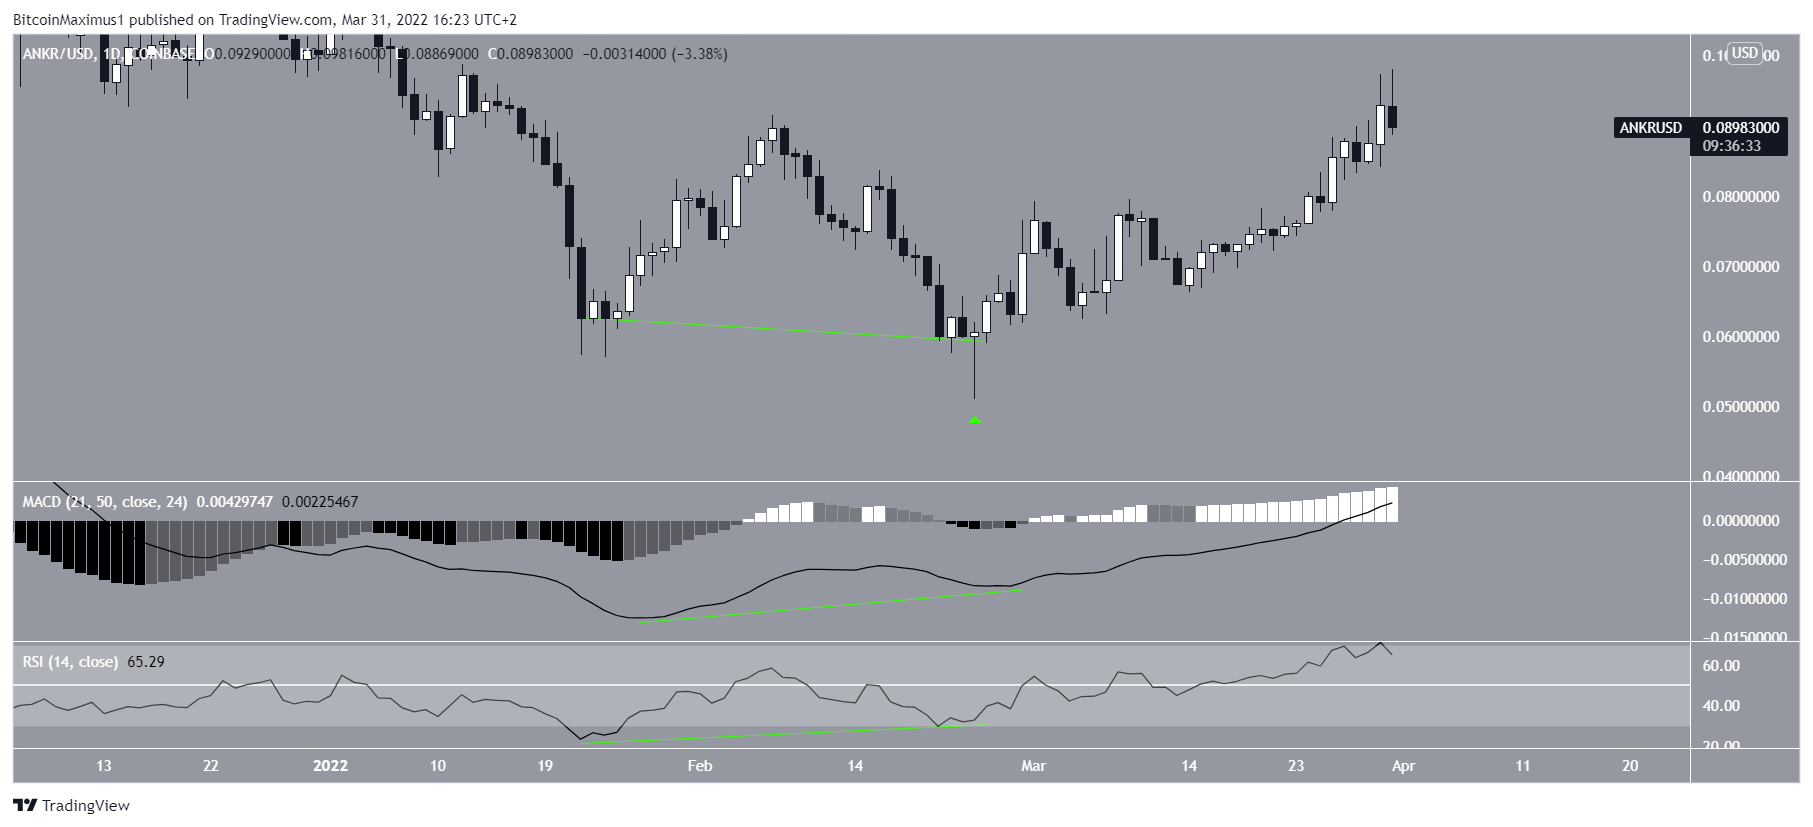
The six-hour chart shows that ANKR has been following an ascending support line since Feb 22. The line is currently at $0.085.
As long as the support line is intact, then so is the bullish trend. Therefore, if tested once more, the price would be expected to bounce at the line and resume its ascent towards $0.132.
Wave count analysis
Cryptocurrency trader @raintrader14 tweeted a chart of ANKR stating that he is expecting the price to increase towards a new all-time high.

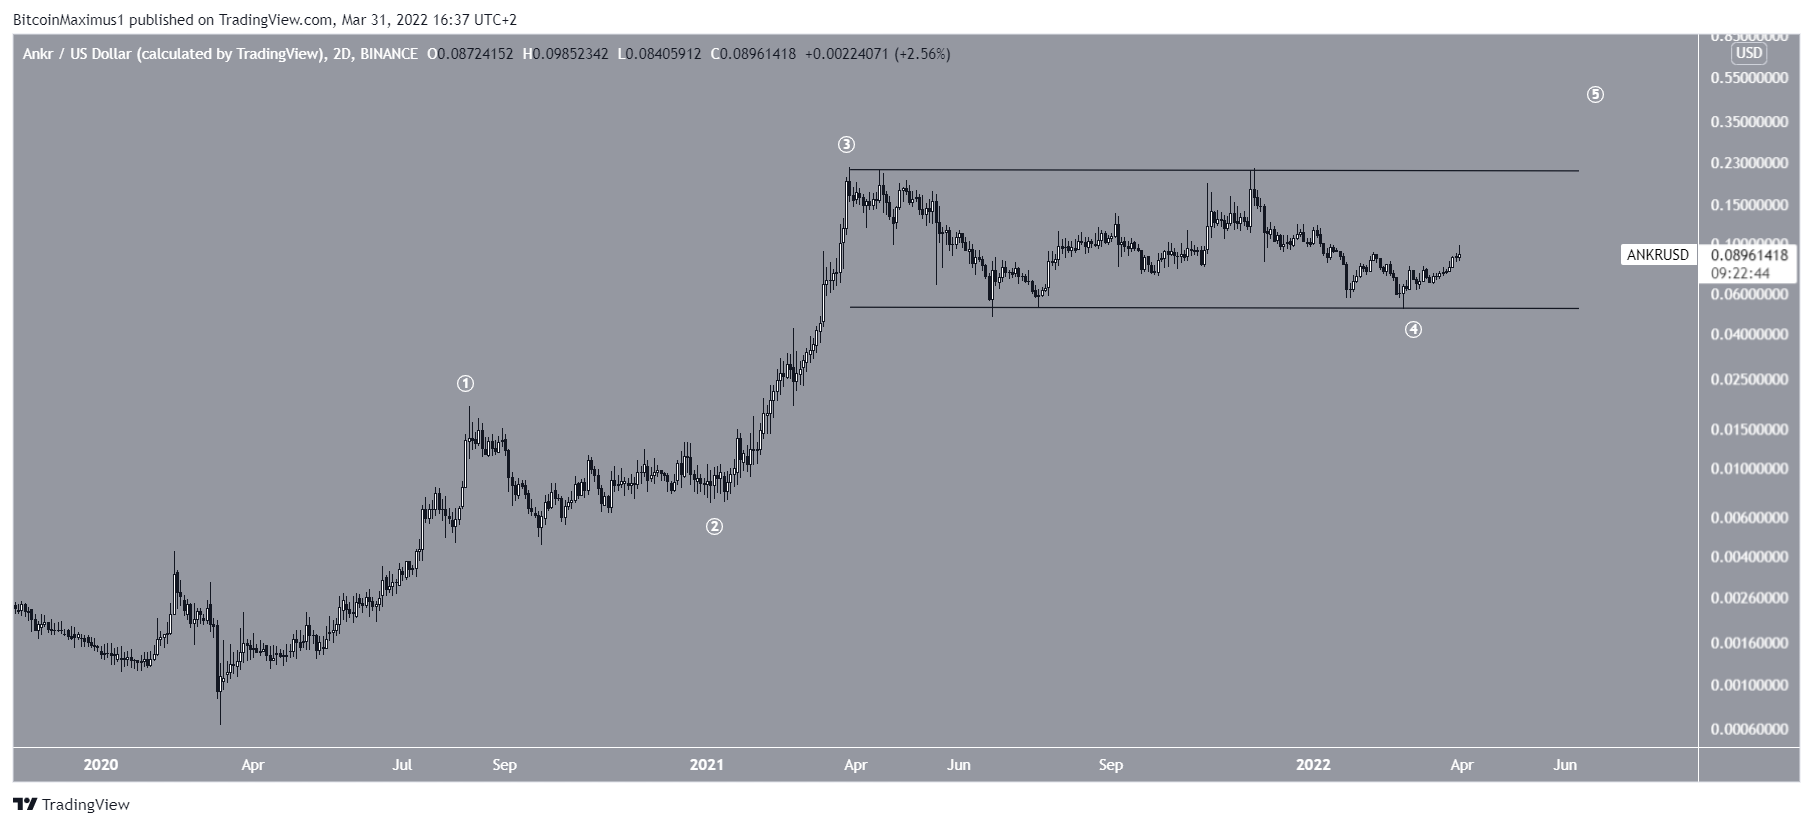
Measuring from the March 2020 low, it is possible that ANKR has just completed wave four of a five wave upward movement (white).
This possibility is supported by the fact that wave four is contained inside a parallel channel. Accordingly, ANKR has now begun wave five which will take it to a new all-time high.
A closer look at the long-term wave four supports this possibility. It shows a completed A-B-C corrective structure (black), in which sub-wave C developed into an ending diagonal (red).
Considering this also aligns with the bullish price action and technical indicator readings, it is very likely that ANKR has completed its correction.
For BeInCrypto’s latest Bitcoin (BTC) analysis, click here.
What do you think about this subject? Write to us and tell us!
Trusted
Disclaimer
In line with the Trust Project guidelines, this price analysis article is for informational purposes only and should not be considered financial or investment advice. BeInCrypto is committed to accurate, unbiased reporting, but market conditions are subject to change without notice. Always conduct your own research and consult with a professional before making any financial decisions. Please note that our Terms and Conditions, Privacy Policy, and Disclaimers have been updated.
