

These altcoins have bullish-looking formations and could reach new all-time highs in February.
The start of 2024 led to mixed price action in the cryptocurrency market. While new highs were seen in the first part of the month, a sharp correction ensued in the latter half. BeInCrypto looks at the top altcoins for February that could hit new all-time highs.
Celestia (TIA) Support Trend Line Can Lead to New Highs
The TIA price has increased alongside an ascending support trend line since the start of November 2023. The upward movement led to a new all-time high price of $20.40 on January 15, 2024.
While the TIA price has fallen since, it bounced on January 23, validating the ascending support trend line and the $14.40 horizontal support area. So far, the trend line has existed for 86 days.
While the price bounced, so did the Relative Strength Index (RSI) (green circle). Market traders use the RSI as a momentum indicator to identify overbought or oversold conditions and to decide whether to accumulate or sell an asset.
Readings above 50 and an upward trend indicate that bulls still have an advantage, whereas readings below 50 suggest the opposite.
Cryptocurrency trader Altcoin Sherpa said that while a new all-time high is possible, he expects the price to continue chopping. If the bounce continues, TIA can increase 43% to the next resistance at $24.60.
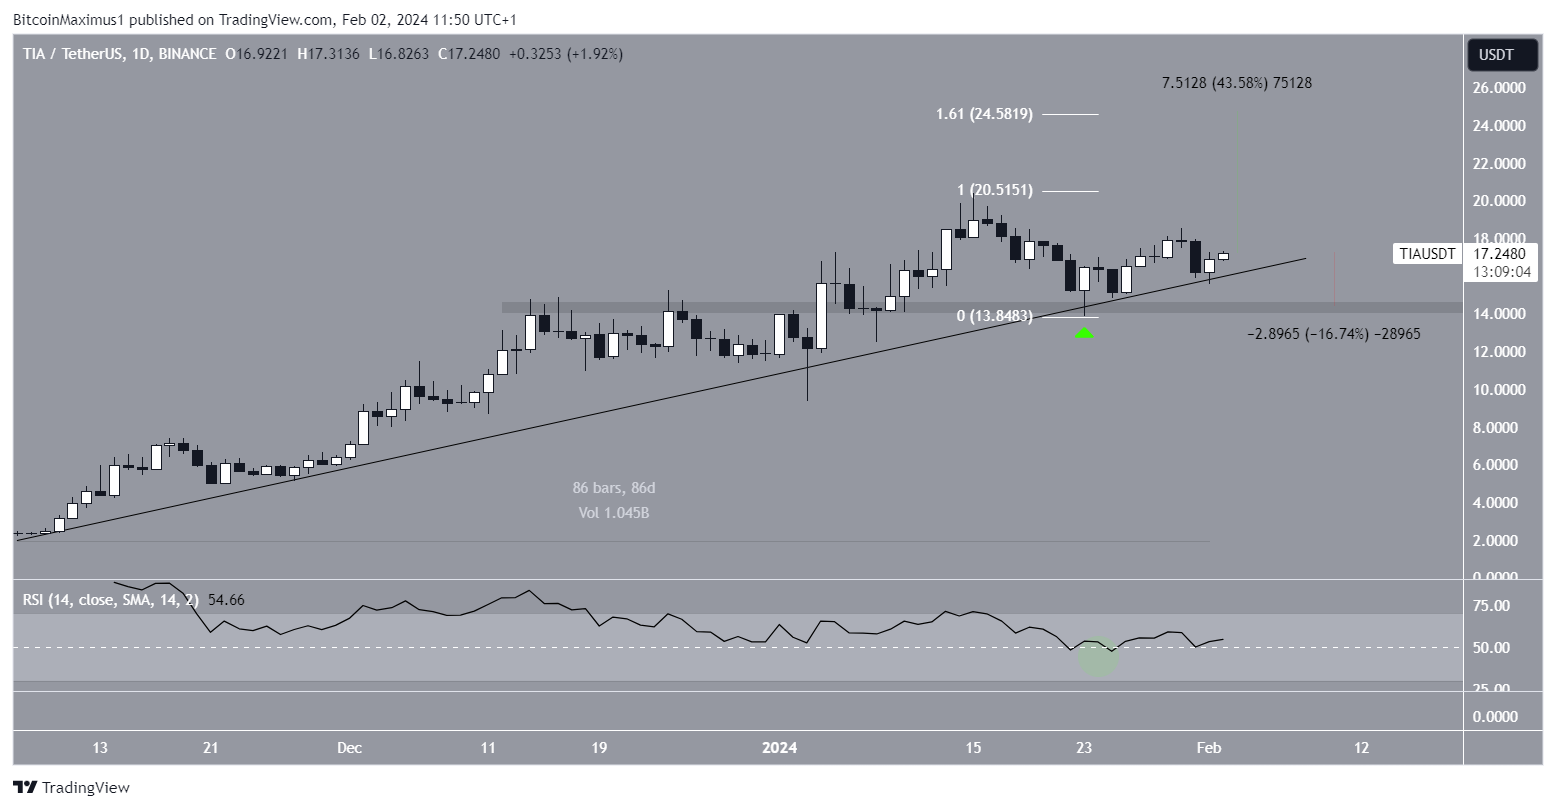
Despite the bullish TIA price prediction, a breakdown from the ascending support trend line can trigger a 16% drop to the $14.40 support area.
PENDLE Increases Parabolically
The PENDLE price has increased alongside a parabolic ascending support trend line since August 2023. The trend line has been validated numerous times, most recently on January 10, 2024 (green icon). The rate of increase accelerated even further after the bounce.
The wave count suggests that PENDLE is in its upward movement’s fifth and final wave. Technical analysts utilize the Elliott Wave theory to ascertain the trend’s direction by studying recurring long-term price patterns and investor psychology.
Since wave five is longer than 0.618 times the length of waves one and three, it will likely extend to the combined length of the previous two waves.
If the increase continues, PENDLE can reach a new all-time high at $3.30, 15% above the current price.
Even though the price movement is positive, cryptocurrency trader Income Sharks believes a short-term correction is due.
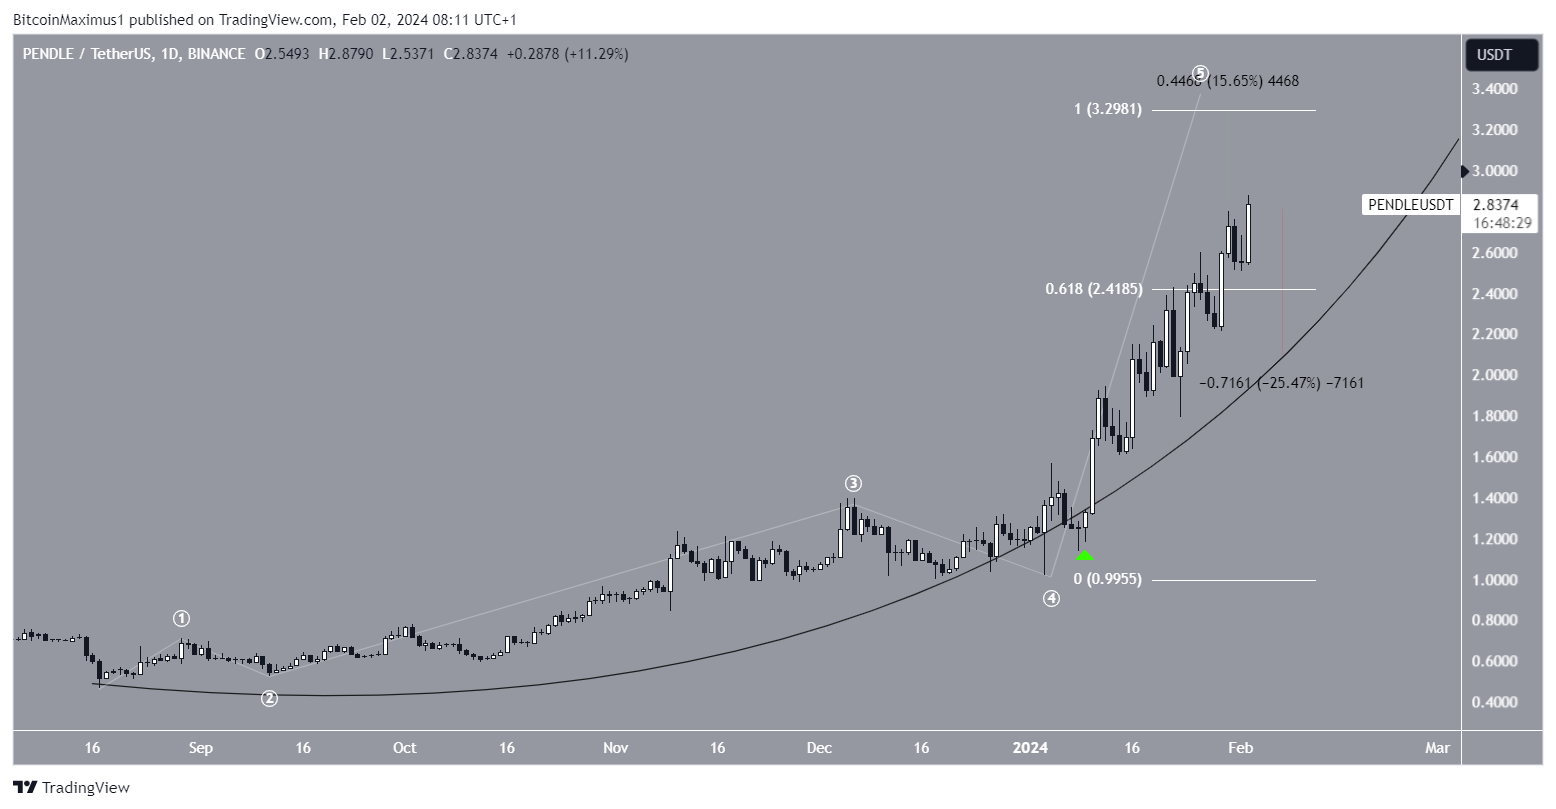
Despite the bullish PENDLE price prediction, closing below $2.40 can trigger a 25% decrease to the parabolic ascending support trend line at $1.90.
Render (RNDR) Concludes All-Time High Altcoins
The weekly time frame technical analysis shows that RNDR has increased in a five-wave upward movement since June 2023. If the count is correct, RNDR is in this upward movement’s fifth and final wave.
The price bounced at the start of the year, validating the $3.60 horizontal support area (green icon) and initiating wave five. If the count is correct, wave five could extend to $8.35, 75% above the current RNDR price. This would be a new all-time high.
Cryptocurrency trader King Crypto believes the increase will continue. He tweeted:
$RNDR / $USDT – 1 Day update The $4.5 resistance is broken, and the retest is almost complete. The next bounce should take us to the $5 zone.
@rendernetwork bulls are proving that the third time’s the charm. Hope you’re enjoying the ride?
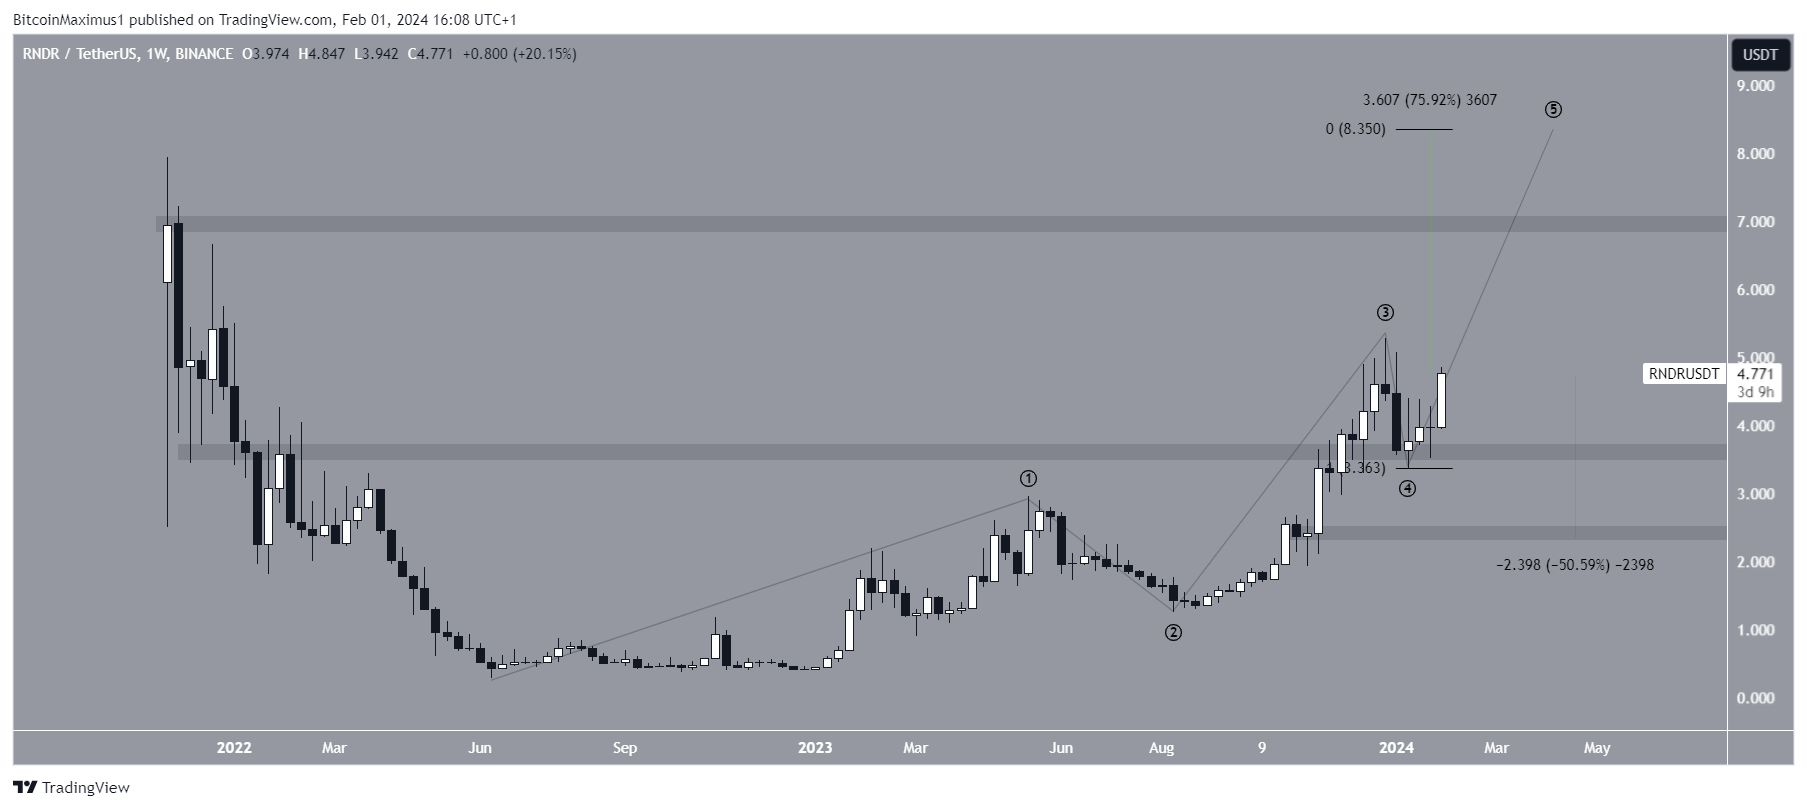
Despite this bullish RNDR price prediction, closing below $3.60 will invalidate the count. Then, RNDR could fall 50% to the closest support at $2.40.
For BeInCrypto’s latest crypto market analysis, click here
Trusted
Disclaimer
In line with the Trust Project guidelines, this price analysis article is for informational purposes only and should not be considered financial or investment advice. BeInCrypto is committed to accurate, unbiased reporting, but market conditions are subject to change without notice. Always conduct your own research and consult with a professional before making any financial decisions. Please note that our Terms and Conditions, Privacy Policy, and Disclaimers have been updated.
