

Solana (SOL), GMX, and Render Token (RNDR) are the weekend’s best altcoin gainers. Solana broke out from a descending wedge, while GMX and RNDR broke out from descending resistance trendlines.
The cryptocurrency market experienced a significant increase on Sunday. This was especially notable in these three altcoin gainers.
Solana Breaks Out from Bullish Pattern
The SOL price bounced at a long-term ascending support line on September 12. It broke out from a descending wedge pattern eight days later.
The descending wedge is considered a bullish pattern, meaning it usually leads to breakouts.
After the breakout, SOL accelerated its rate of increase on September 27. This culminated with a high of $24.80 on October 2. The price has nearly reached the main resistance area at $27.
Read more: Solana (SOL) price prediction
The RSI supports the breakout. Investors rely on the RSI to measure momentum when buying or selling assets. An RSI reading that exceeds 50 in an uptrend is generally perceived as an encouraging sign for bulls, whereas a reading falling below 50 is interpreted as bearish.
Readings above 50 and an upward trend indicate that bulls still have an advantage, whereas readings below 50 suggest the opposite.
The indicator broke out from its divergence trendline (green). It is now increasing and above 50. Both these are considered signs of a bullish trend.
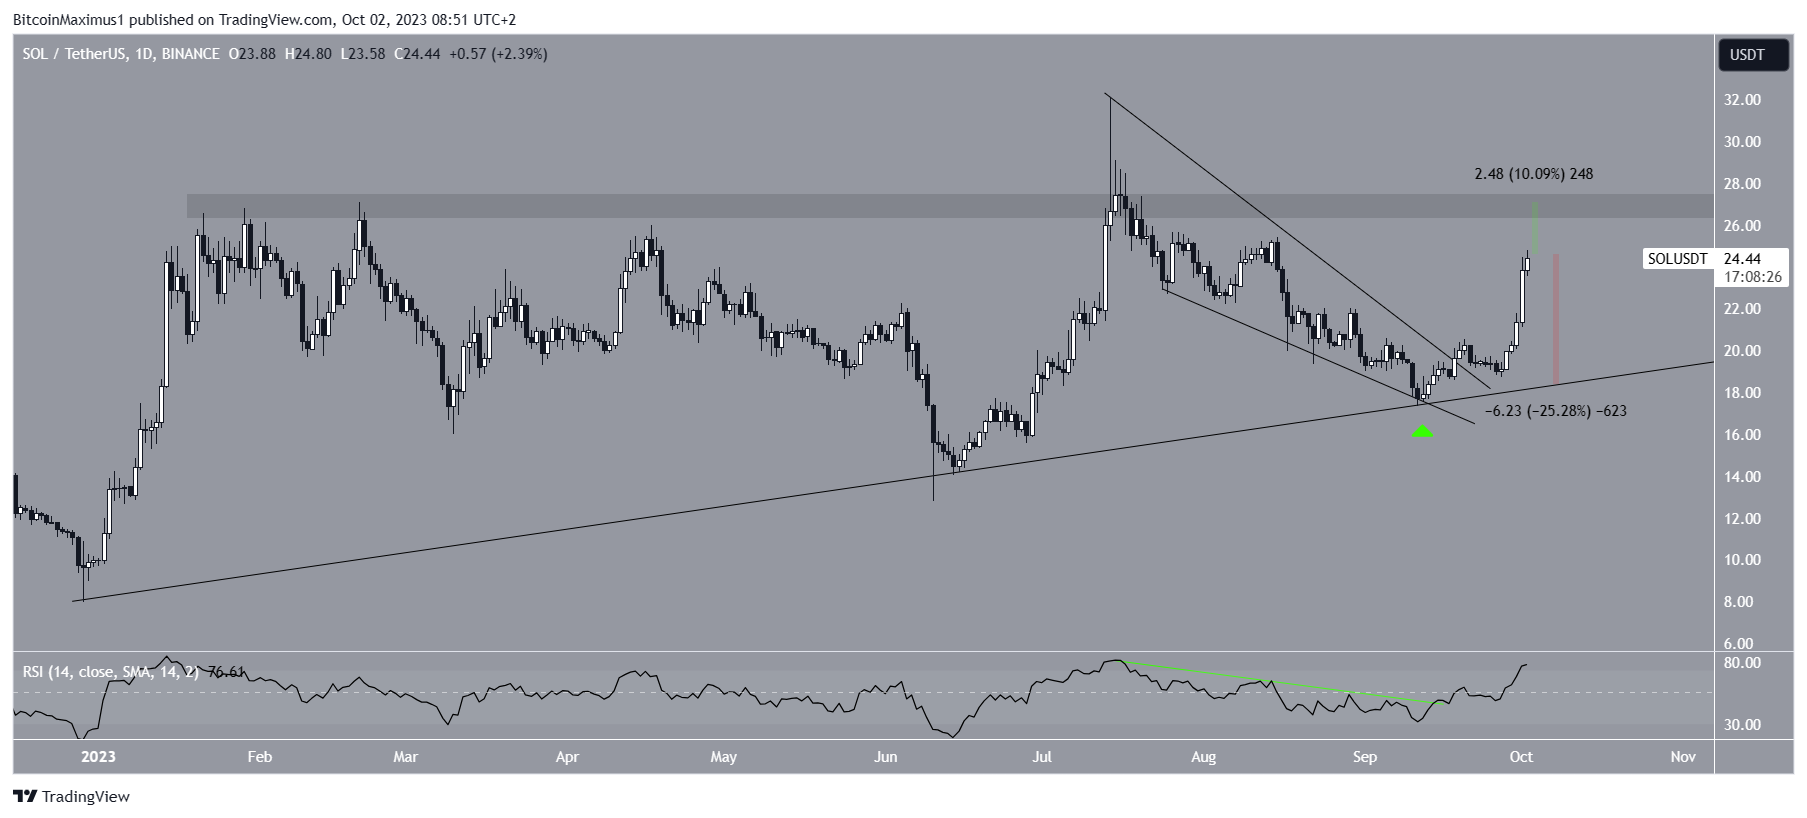
If the increase continues, the $27 resistance area will be only 10% above the current price. On the other hand, a 25% drop will be required for the price to reach the long-term ascending support line at $18.50.
GMX Clears Long-Term Resistance
The GMX price has increased since its low of $28.16 on August 17. At the beginning of September, the price created a higher low and then accelerated its rate of increase.
On September 19, the price broke out from a descending resistance trendline that had been in place for 163 days. Breakouts from such long-term structures often lead to significant upward movements.
Similarly to Solana, the daily RSI for GMX supports the continuing increase. The indicator is moving upwards and is above 50, both signs of a bullish trend.
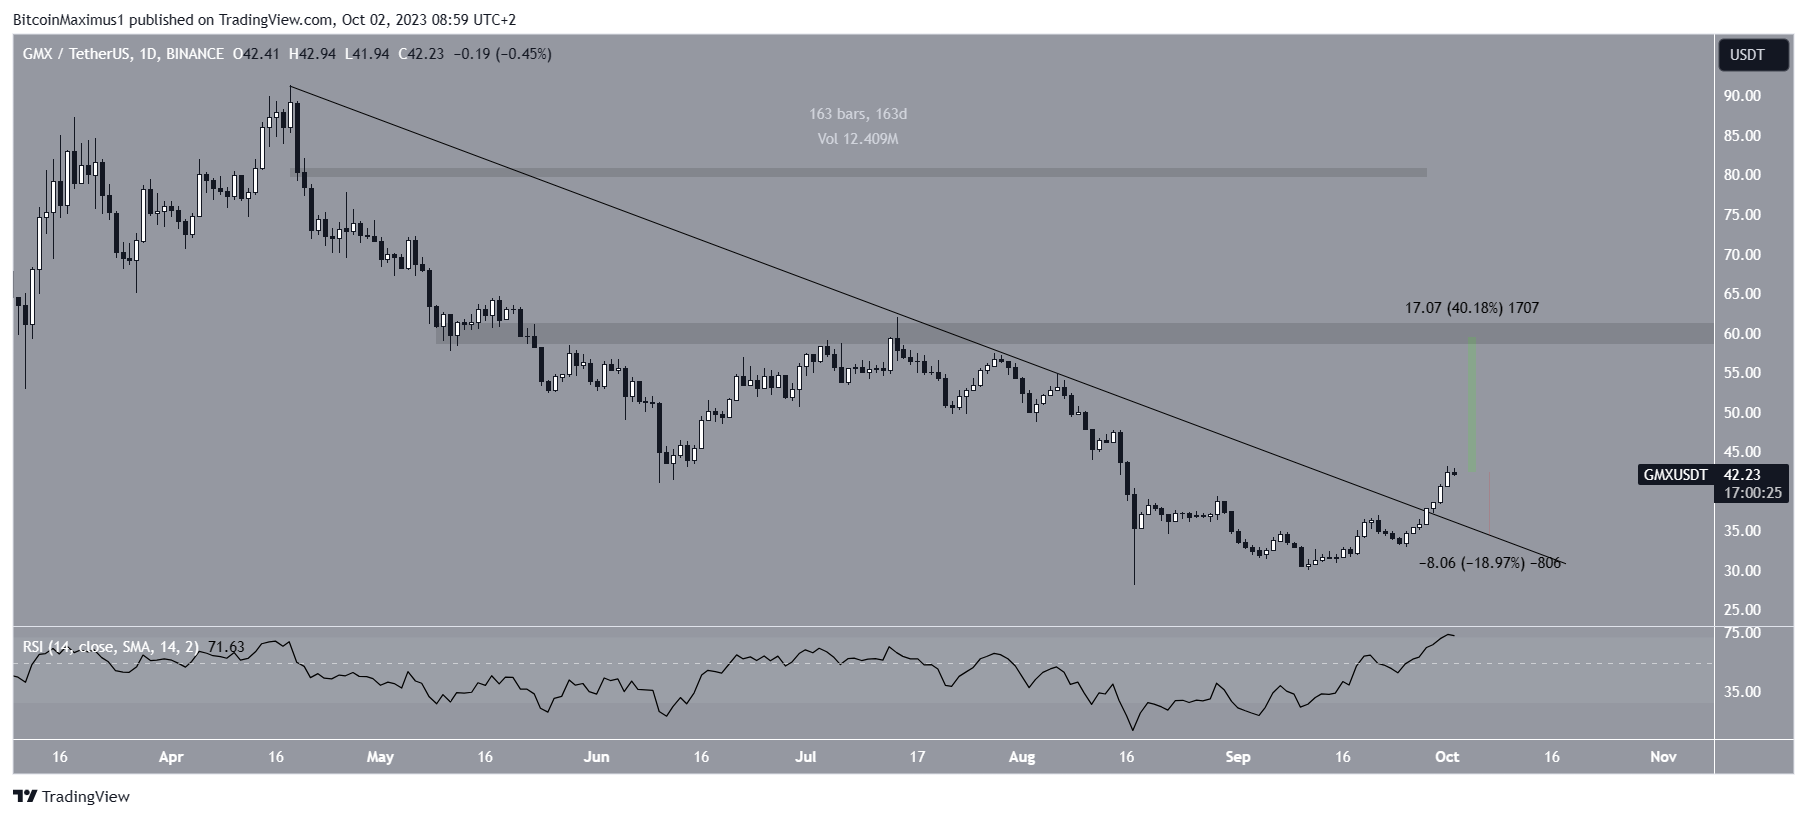
If the increase continues, the $60 resistance area will be 40% above the current price.
On the other hand, a drop at the previous descending resistance trendline at $34 will be the most likely scenario. The line is 20% below the current price.
Read More: Best Crypto Sign-Up Bonuses in 2023
RNDR Concludes Altcoin Gainers
The RNDR price has increased since breaking out from a descending resistance trendline on September 7. The rate of increase accelerated after the price created a higher low on September 27.
The daily RSI is also bullish in the case of RNDR. The indicator is above 50 and increasing, legitimizing the breakout from the descending resistance trendline.
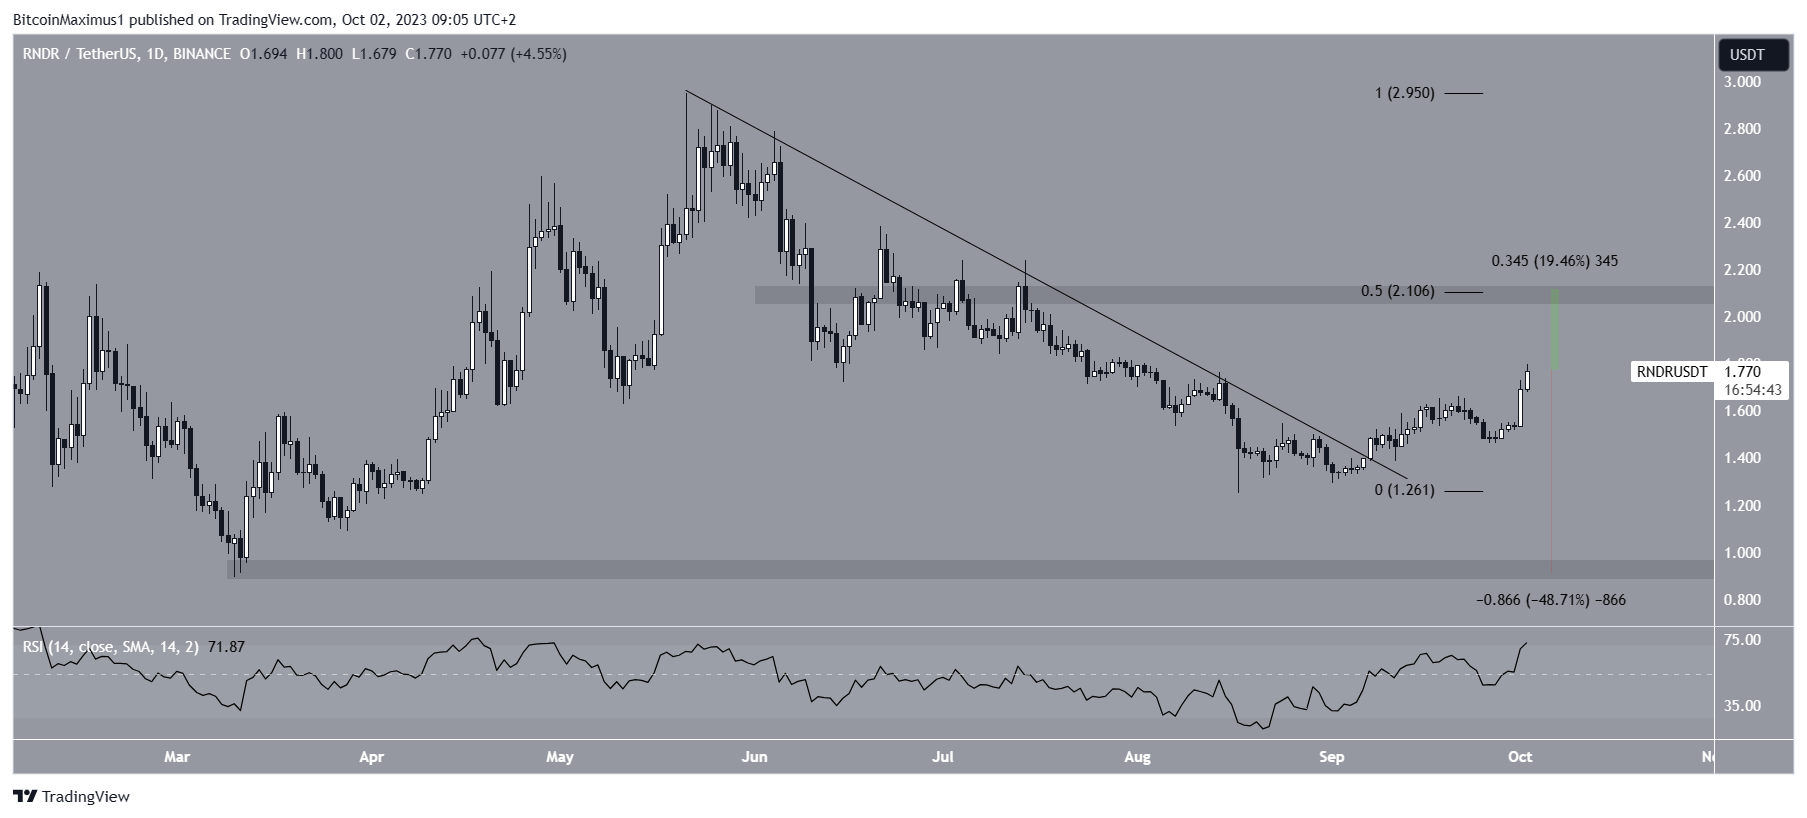
The next closest resistance area is at $2.10, created by the 0.5 Fib retracement resistance level and a horizontal resistance area. On the other hand, a drop to the closest support at $0.95 would amount to a decrease of 50%.
Read More: Top 11 Crypto Communities to Join in 2023
For BeInCrypto’s latest crypto market analysis, click here.
Trusted
Disclaimer
In line with the Trust Project guidelines, this price analysis article is for informational purposes only and should not be considered financial or investment advice. BeInCrypto is committed to accurate, unbiased reporting, but market conditions are subject to change without notice. Always conduct your own research and consult with a professional before making any financial decisions. Please note that our Terms and Conditions, Privacy Policy, and Disclaimers have been updated.
