

The price of Cardano (ADA) broke down from an ascending support line in August. The price fell toward its yearly lows but bounced, validating the $0.25 horizontal support area.
Despite the ongoing bounce, readings from the weekly and daily timeframes are bearish, supporting the continuing decrease.
Cardano Returns to Pre-Breakout Levels
The weekly timeframe technical analysis shows that ADA broke out from a long-term descending resistance line at the beginning of the year. The line had previously been in place since the all-time high.
Therefore, the breakout from it was a sign that the correction was over, and ADA had begun a new bullish trend reversal.
However, the upward movement did not materialize as expected. On the contrary, the price was rejected by the $0.45 horizontal resistance area in April (red icon) and has fallen since.
In June, ADA fell to a low of $0.22. This was considerably below the pre-breakout levels and was also a new yearly low. The price bounced afterward (green icon), creating a slightly higher low (white icon), validating the $0.25 area as support.
Crypto investing, simplified. Get ADA price predictions here.
If a bounce occurs, the price can increase by 70% and reach the $0.45 area again. On the other hand, a breakdown from the $0.25 area can cause a 40% drop to the $0.15 horizontal support.
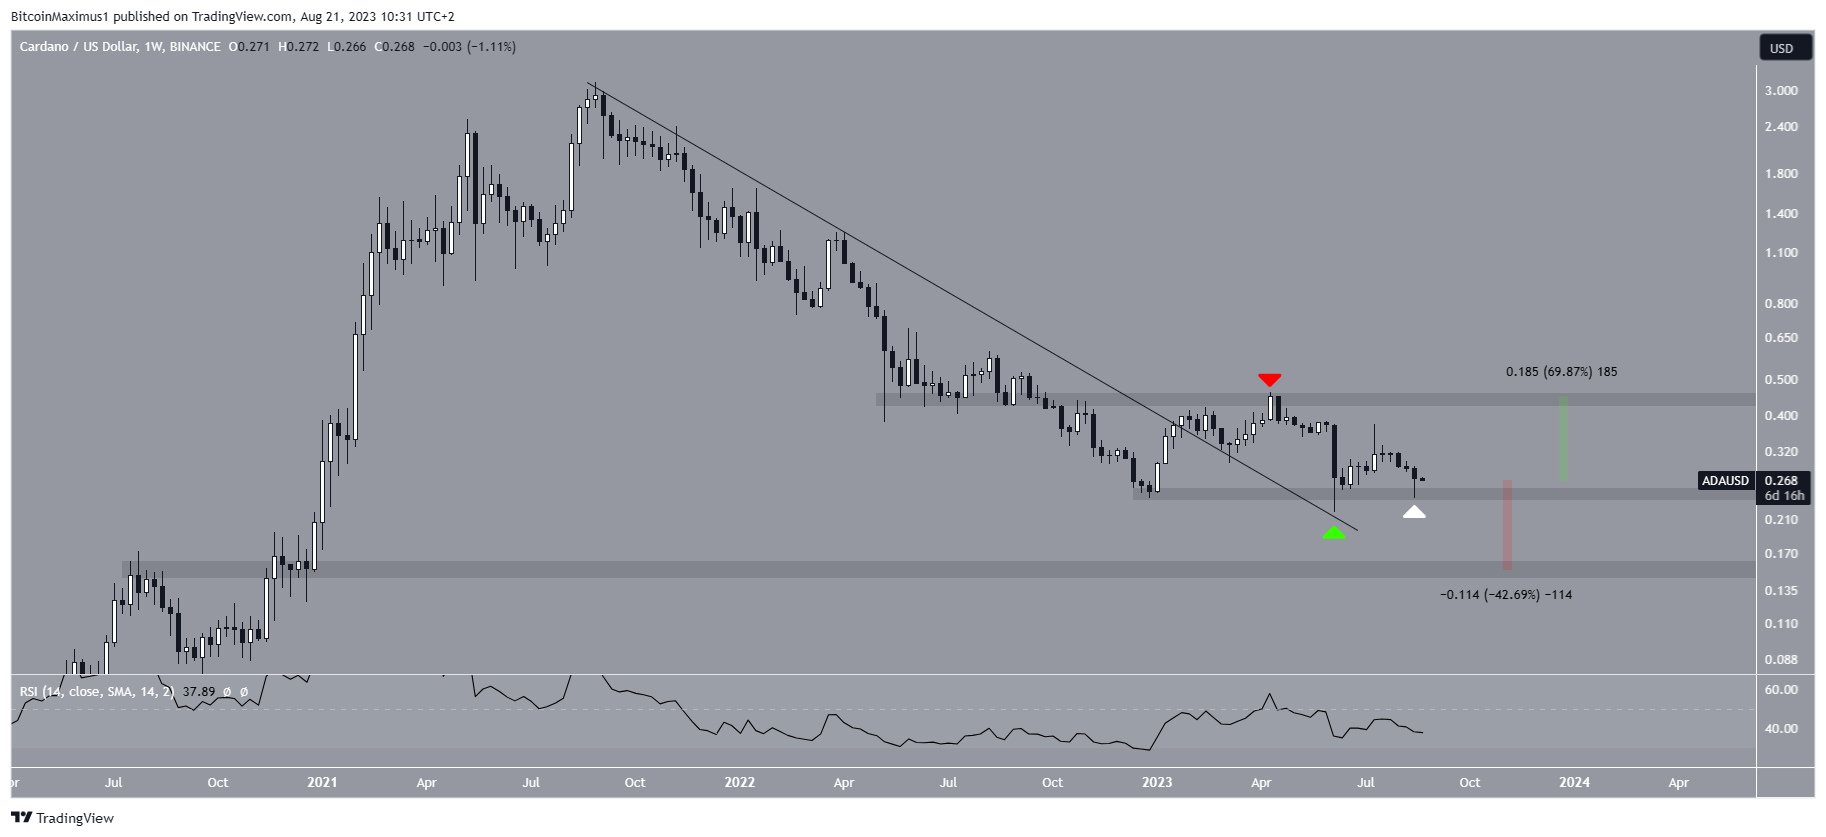
The weekly RSI gives a bearish reading. When evaluating market conditions, traders use the RSI as a momentum indicator to determine if a market is overbought or oversold and to decide whether to accumulate or sell an asset.
If the RSI reading is above 50 and the trend is upward, bulls still have an advantage, but if the reading is below 50, the opposite is true. The indicator is decreasing and is below 50, both signs of a bearish trend.
ADA Price Prediction: Will Bounce Be Sufficient to Save Breakdown?
The daily timeframe analysis also gives a bearish perspective. This is because of the price action and the application of the Elliott Wave principle.
The wave count shows a completed A-B-C structure (black) since the June lows. Since the correction faces upwards, it means that the trend is likely bearish.
This perspective was strengthened by the ADA price breaking down from an ascending support line at the beginning of August. This happened despite a positive announcement by Charles Hoskinson.
After the breakdown, ADA fell to a low of $0.24 but bounced, validating the $0.25 area as support. However, the RSI does not support the bounce. The indicator fell below 50 (red circle) at the beginning of August and has fallen since.
So, a return to the $0.25 area would mark an 8% drop, while a breakdown could cause a more than 40% decrease.
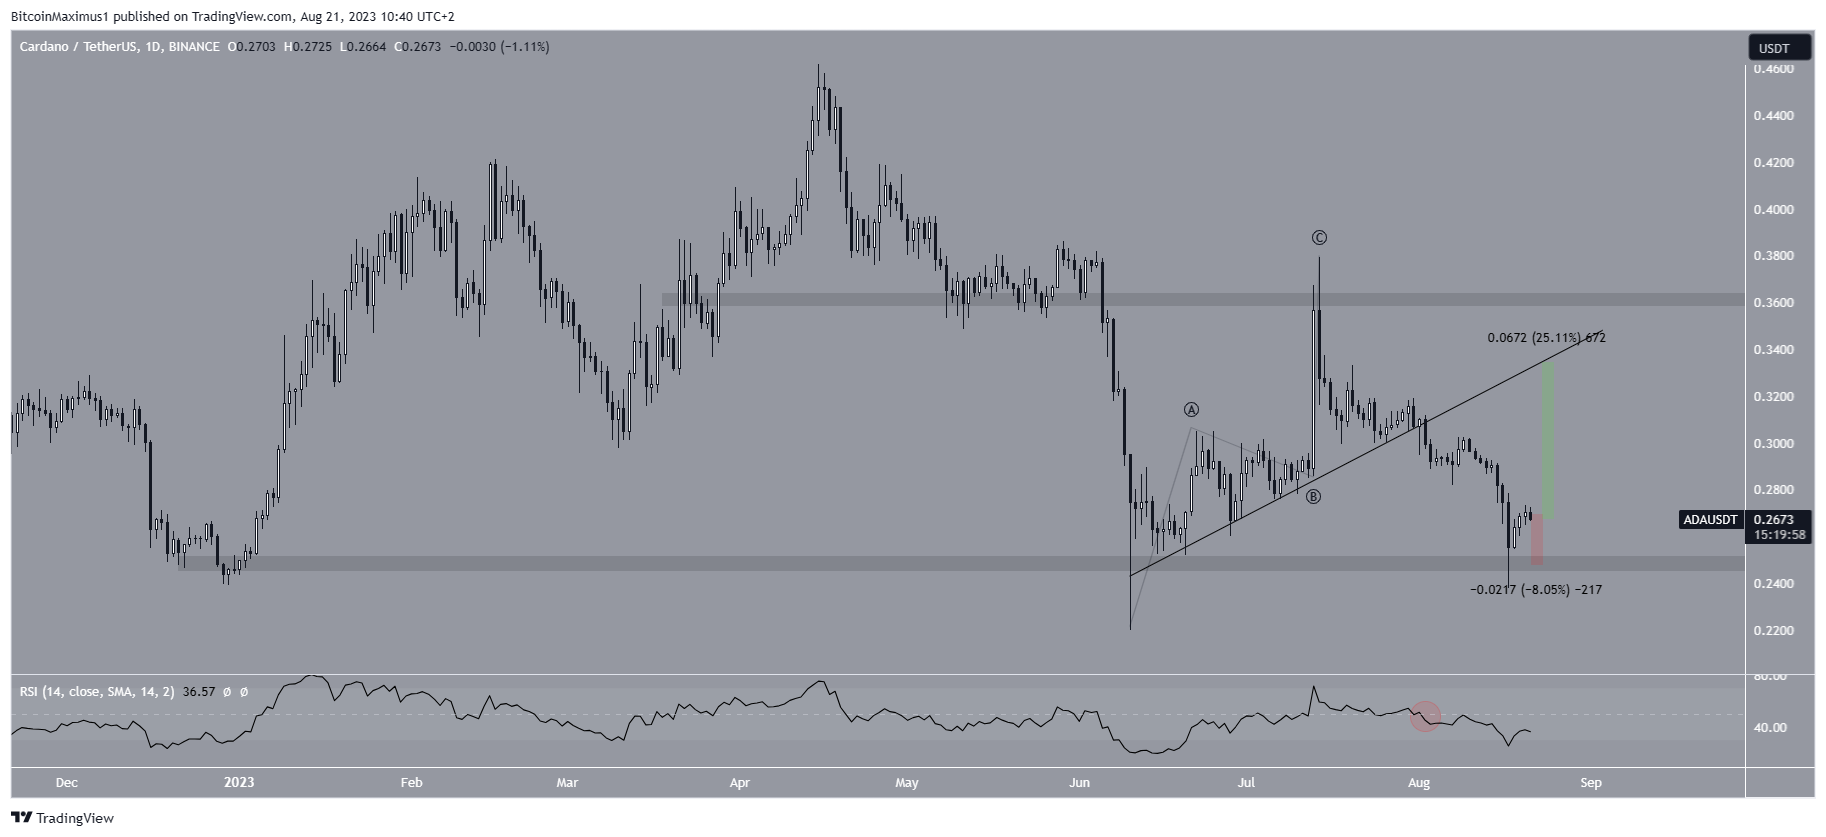
Despite this bearish ADA price prediction, the continuing upward movement could lead to a 25% increase that takes the price to the previous ascending support line, currently at $0.34.
Trade With AI – 9 Best AI Crypto Trading Bots to Maximize Your Profits
For BeInCrypto’s latest crypto market analysis, click here.
Trusted
Disclaimer
In line with the Trust Project guidelines, this price analysis article is for informational purposes only and should not be considered financial or investment advice. BeInCrypto is committed to accurate, unbiased reporting, but market conditions are subject to change without notice. Always conduct your own research and consult with a professional before making any financial decisions. Please note that our Terms and Conditions, Privacy Policy, and Disclaimers have been updated.
