

Typically, when Bitcoin sets a new all-time high, risk warnings start to appear. However, experts and analysts highlight three new positive Bitcoin metrics emerging in August.
These metrics act as rare signals. They suggest that Bitcoin Season may have only begun this month, even after the price broke above $120,000.
1. Bitcoin Futures-to-Spot Ratio
The first is the Futures-to-Spot Ratio, which has dropped to its lowest level since October 2022. Why is this significant?
According to Swissblock, this ratio measures futures trading volume compared to spot trading volume. A lower ratio indicates that large investors — often called massive allocators — are actively buying BTC on the spot market instead of speculating via futures.
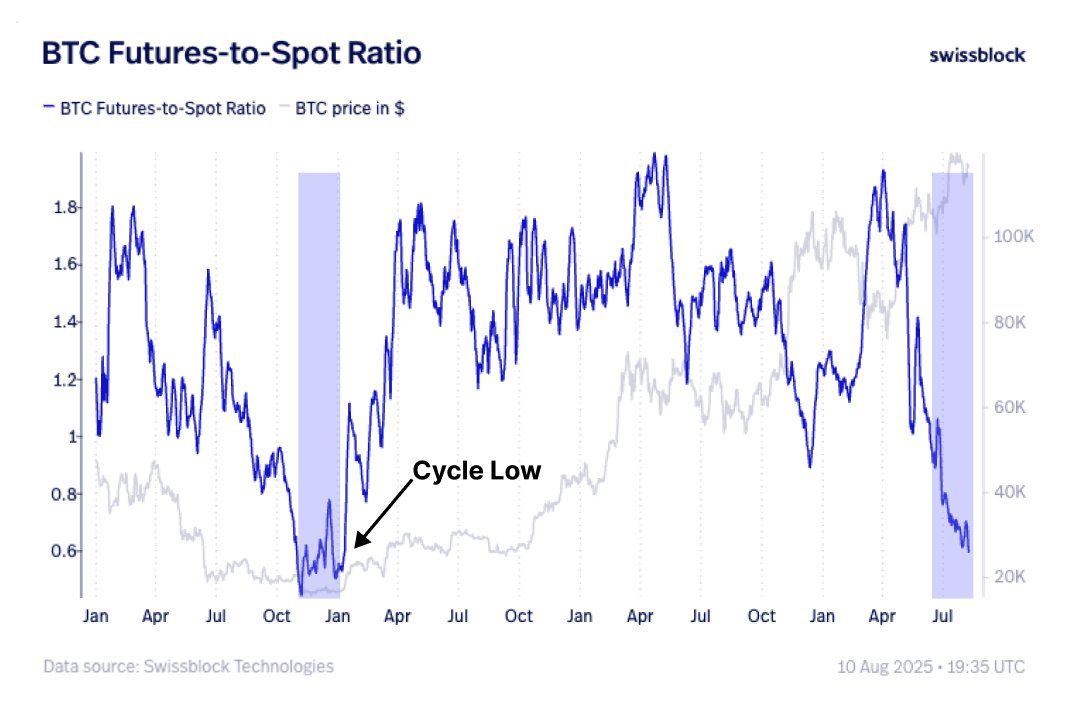
“Since the April low, this move has been spot-driven — massive allocators hoovering up every last BTC. Futures-to-spot ratio is back to Oct 2022 lows → a signal of epic spot demand,” Swissblock reported.
Historically, when this ratio plunges, it often marks the cycle’s bottom — similar to late 2022 before BTC skyrocketed above $100,000. This suggests that even with Bitcoin already in six-figure territory, the rally might still be in its early stages.
“The $120.5K breakout target has been hit, now what? Price momentum is aligning… Yes, macro volatility is expected and downside pressure may flare up, but with momentum igniting, we go higher,” Swissblock predicted.
2. CEX Volume Ratio: Bitcoin vs. Altcoins
The second metric is the spot trading volume ratio between Bitcoin and altcoins.
This ratio compares BTC’s spot trading volume to altcoins on centralized exchanges (CEX). When the ratio rises, it shows Bitcoin is attracting more capital — a classic sign of “Bitcoin Season.”
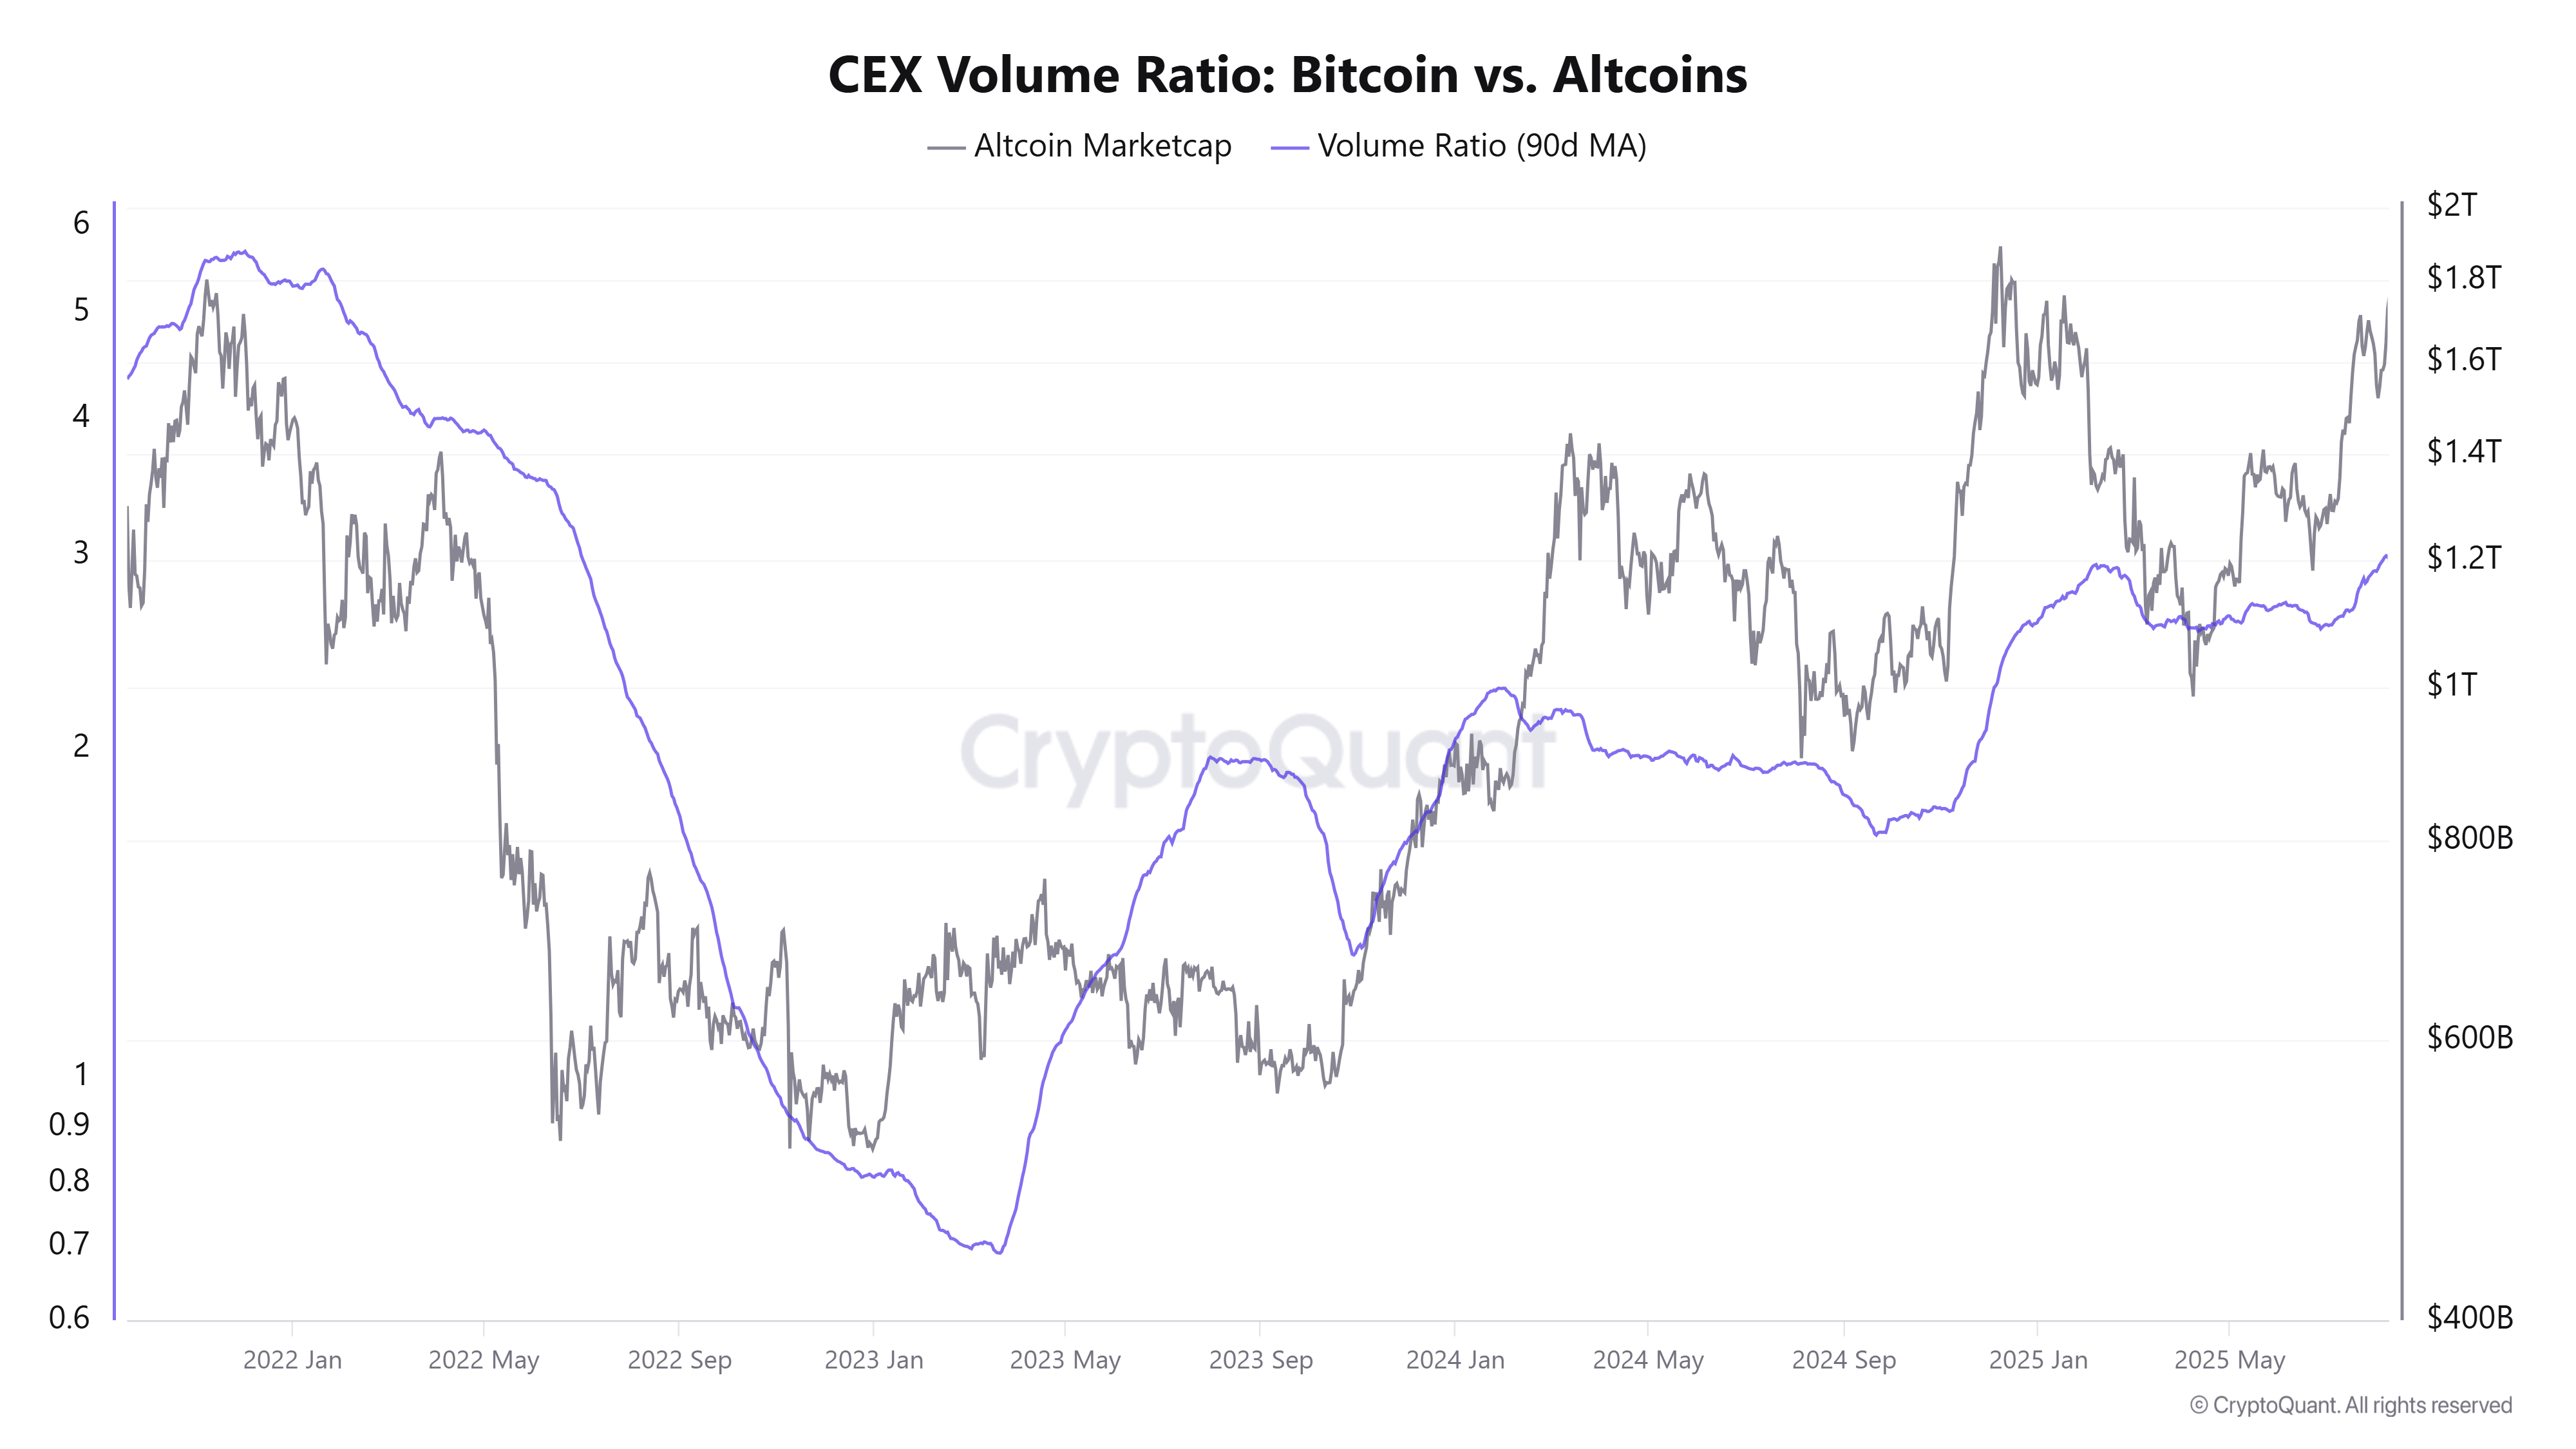
CryptoQuant data reveals that this ratio tends to rise alongside Bitcoin’s price. In August 2025, it has rebounded to 3 — its highest since July 2022. This means Bitcoin’s trading volume is now triple that of all altcoins combined.
History shows that when the ratio surpasses 3 and moves toward 5 (as it did in late 2021), BTC often leads strong market rallies. This suggests that today’s market conditions indicate Bitcoin Season hasn’t yet reached its full potential.
3. Bitcoin Taker Buy-Sell Ratio
Finally, the Taker Buy-Sell Ratio indicates that new buying momentum is building strongly.
According to CryptoQuant analyst Crazzyblockk, this ratio measures the buying volume divided by the selling volume from takers — the active traders initiating market orders.
“Takers set the immediate tone of the market — when they’re aggressively buying, it often precedes bullish moves; when selling dominates, it can signal downside risk,” Crazzyblockk explained.
A value above 1 signals bullish sentiment. Crazzyblockk also notes that when this value exceeds its 7-day average, it signals fresh buying momentum.
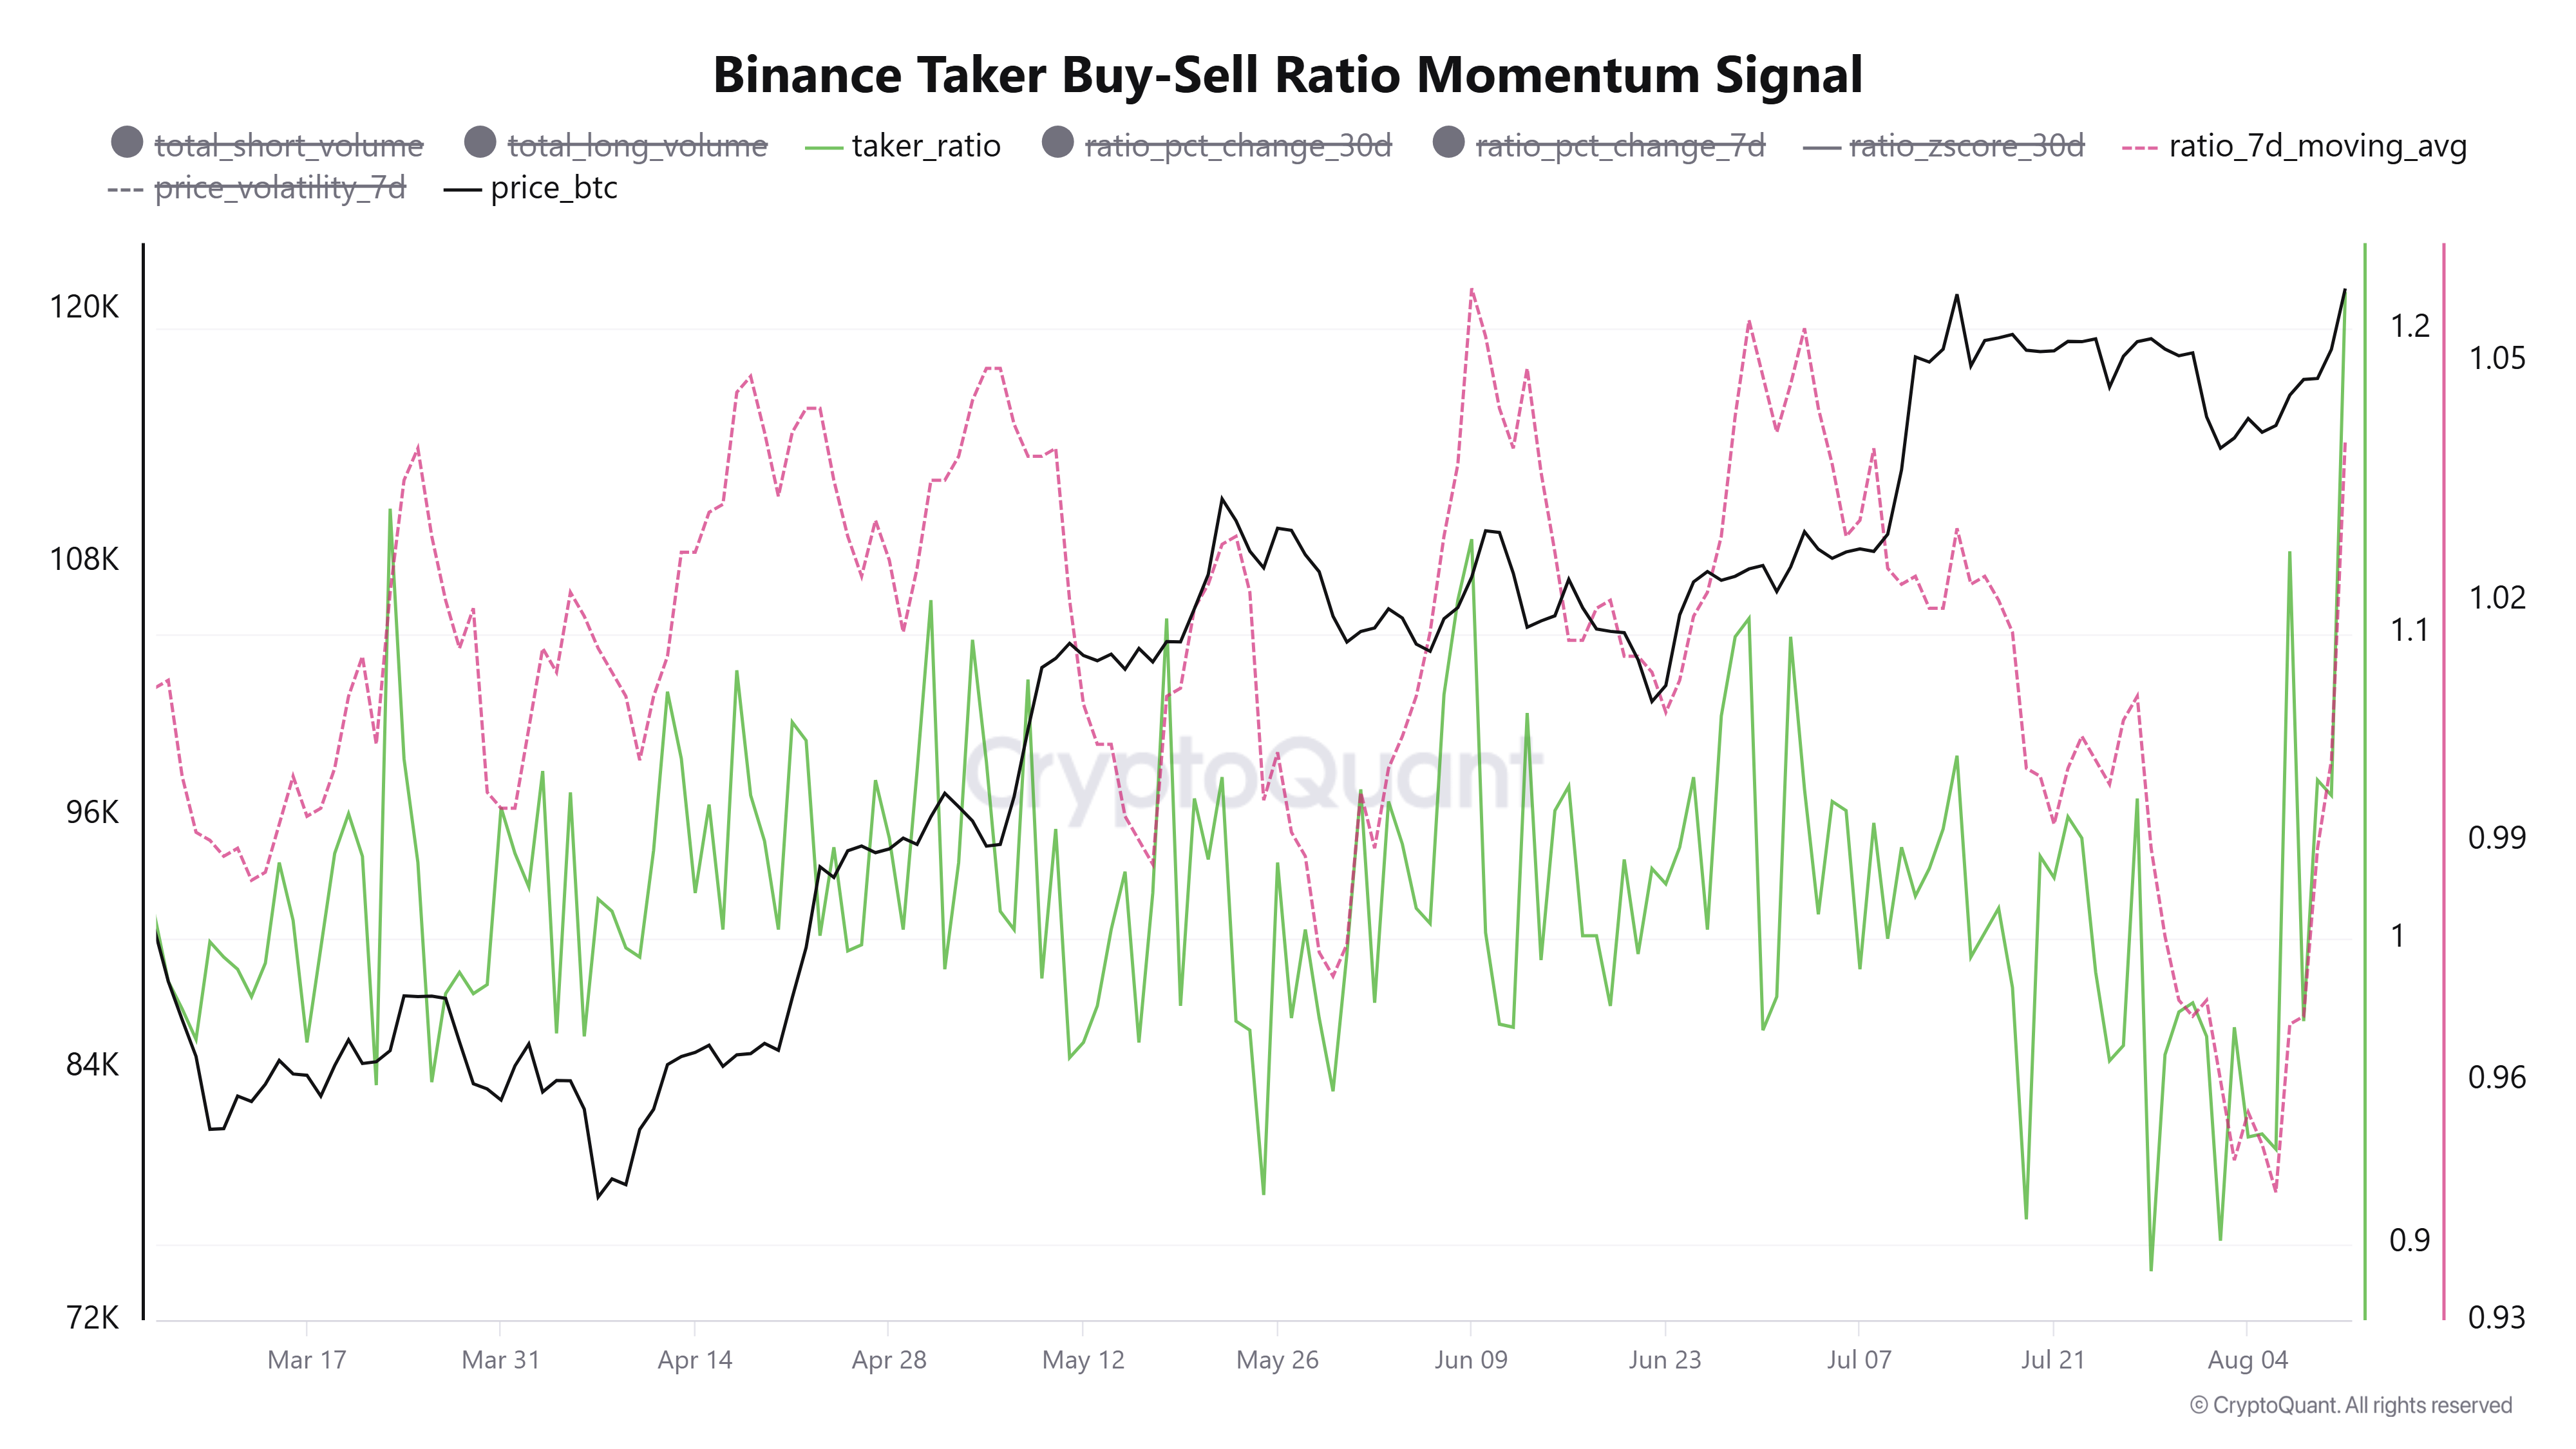
This signal was confirmed in August. The Bitcoin Taker Buy-Sell Ratio exceeded its 7-day average and reached 1.21 — the highest since March.
These three metrics — record-low Futures-to-Spot Ratio, recovering CEX Volume Ratio, and bullish Taker Buy-Sell Ratio — all point to Bitcoin Season kicking off in August 2025.
Additionally, recent BeInCrypto analysis suggests Bitcoin could climb further. However, it warns that a drop below $118,900 would invalidate the short-term bullish trend.
Disclaimer
In adherence to the Trust Project guidelines, BeInCrypto is committed to unbiased, transparent reporting. This news article aims to provide accurate, timely information. However, readers are advised to verify facts independently and consult with a professional before making any decisions based on this content. Please note that our Terms and Conditions, Privacy Policy, and Disclaimers have been updated.