

Bitcoin price hasn’t gone anywhere this week. Even after touching an all-time high of $122,000 recently, the price has mostly stayed stuck. It’s down 3.1% in the last 7 days, and only up 5.8% for the past month.
With ETF outflows now topping $1 billion, marking the longest streak since April, many traders expected deeper corrections. But while price struggles to move past one key level, multiple signals hint that Bitcoin might be setting up for something bigger, if and when that level is broken.
Short-Term Sellers Are Still Bleeding, But Slowing Down
Every time the Bitcoin price has touched $115,000 or any local top over the past month, short-term holders, those who bought BTC in the last few weeks, have started selling. The spent output age bands show this clearly. On July 22, July 28, and even August 6, Bitcoin tried to push higher, but selling from wallets holding BTC for under a month picked up right at the top.

This shows that short-term traders are booking quick profits, causing local tops in the Spent Output metric. But something changed after July 25. These selling spikes are getting weaker. That means short-term traders may be running out of BTC to sell, or getting more confident in holding. If this continues, Bitcoin could finally break through resistance.
The Spent Output Age Bands metric tracks coins that were moved (or “spent”) based on how long they were held. High movement from young coins (0–1 day, 1–7 days, 7–30 days) often signals selling pressure.
For token TA and market updates: Want more token insights like this? Sign up for Editor Harsh Notariya’s Daily Crypto Newsletter here.
Bottom Signal from SOPR?
The Spent Output Profit Ratio (SOPR) measures whether BTC holders are selling at a profit or a loss. It usually peaks when people lock in profits at the top, and drops when they sell at a loss, often near bottoms.

We’ve seen this pattern play out multiple times recently:
- July 16: SOPR hit 1.06, price topped around $118K.
- July 25: SOPR dropped from 1.016 to 1.01, but the Bitcoin price actually rose, showing divergence.
- August 5: SOPR dropped again while the price rose from $114,000 to $115,000.
That means fewer sellers are in profit, and some are likely exiting at a loss. When this happens alongside a stable or rising price, it often points to a market bottom forming.
Bitcoin Price Pattern Still Bullish, Despite Rejections
Even though the Bitcoin price keeps failing to break above the resistance zone near $115,000, one important signal shows the trend may still be bullish: the Relative Strength Index (RSI).
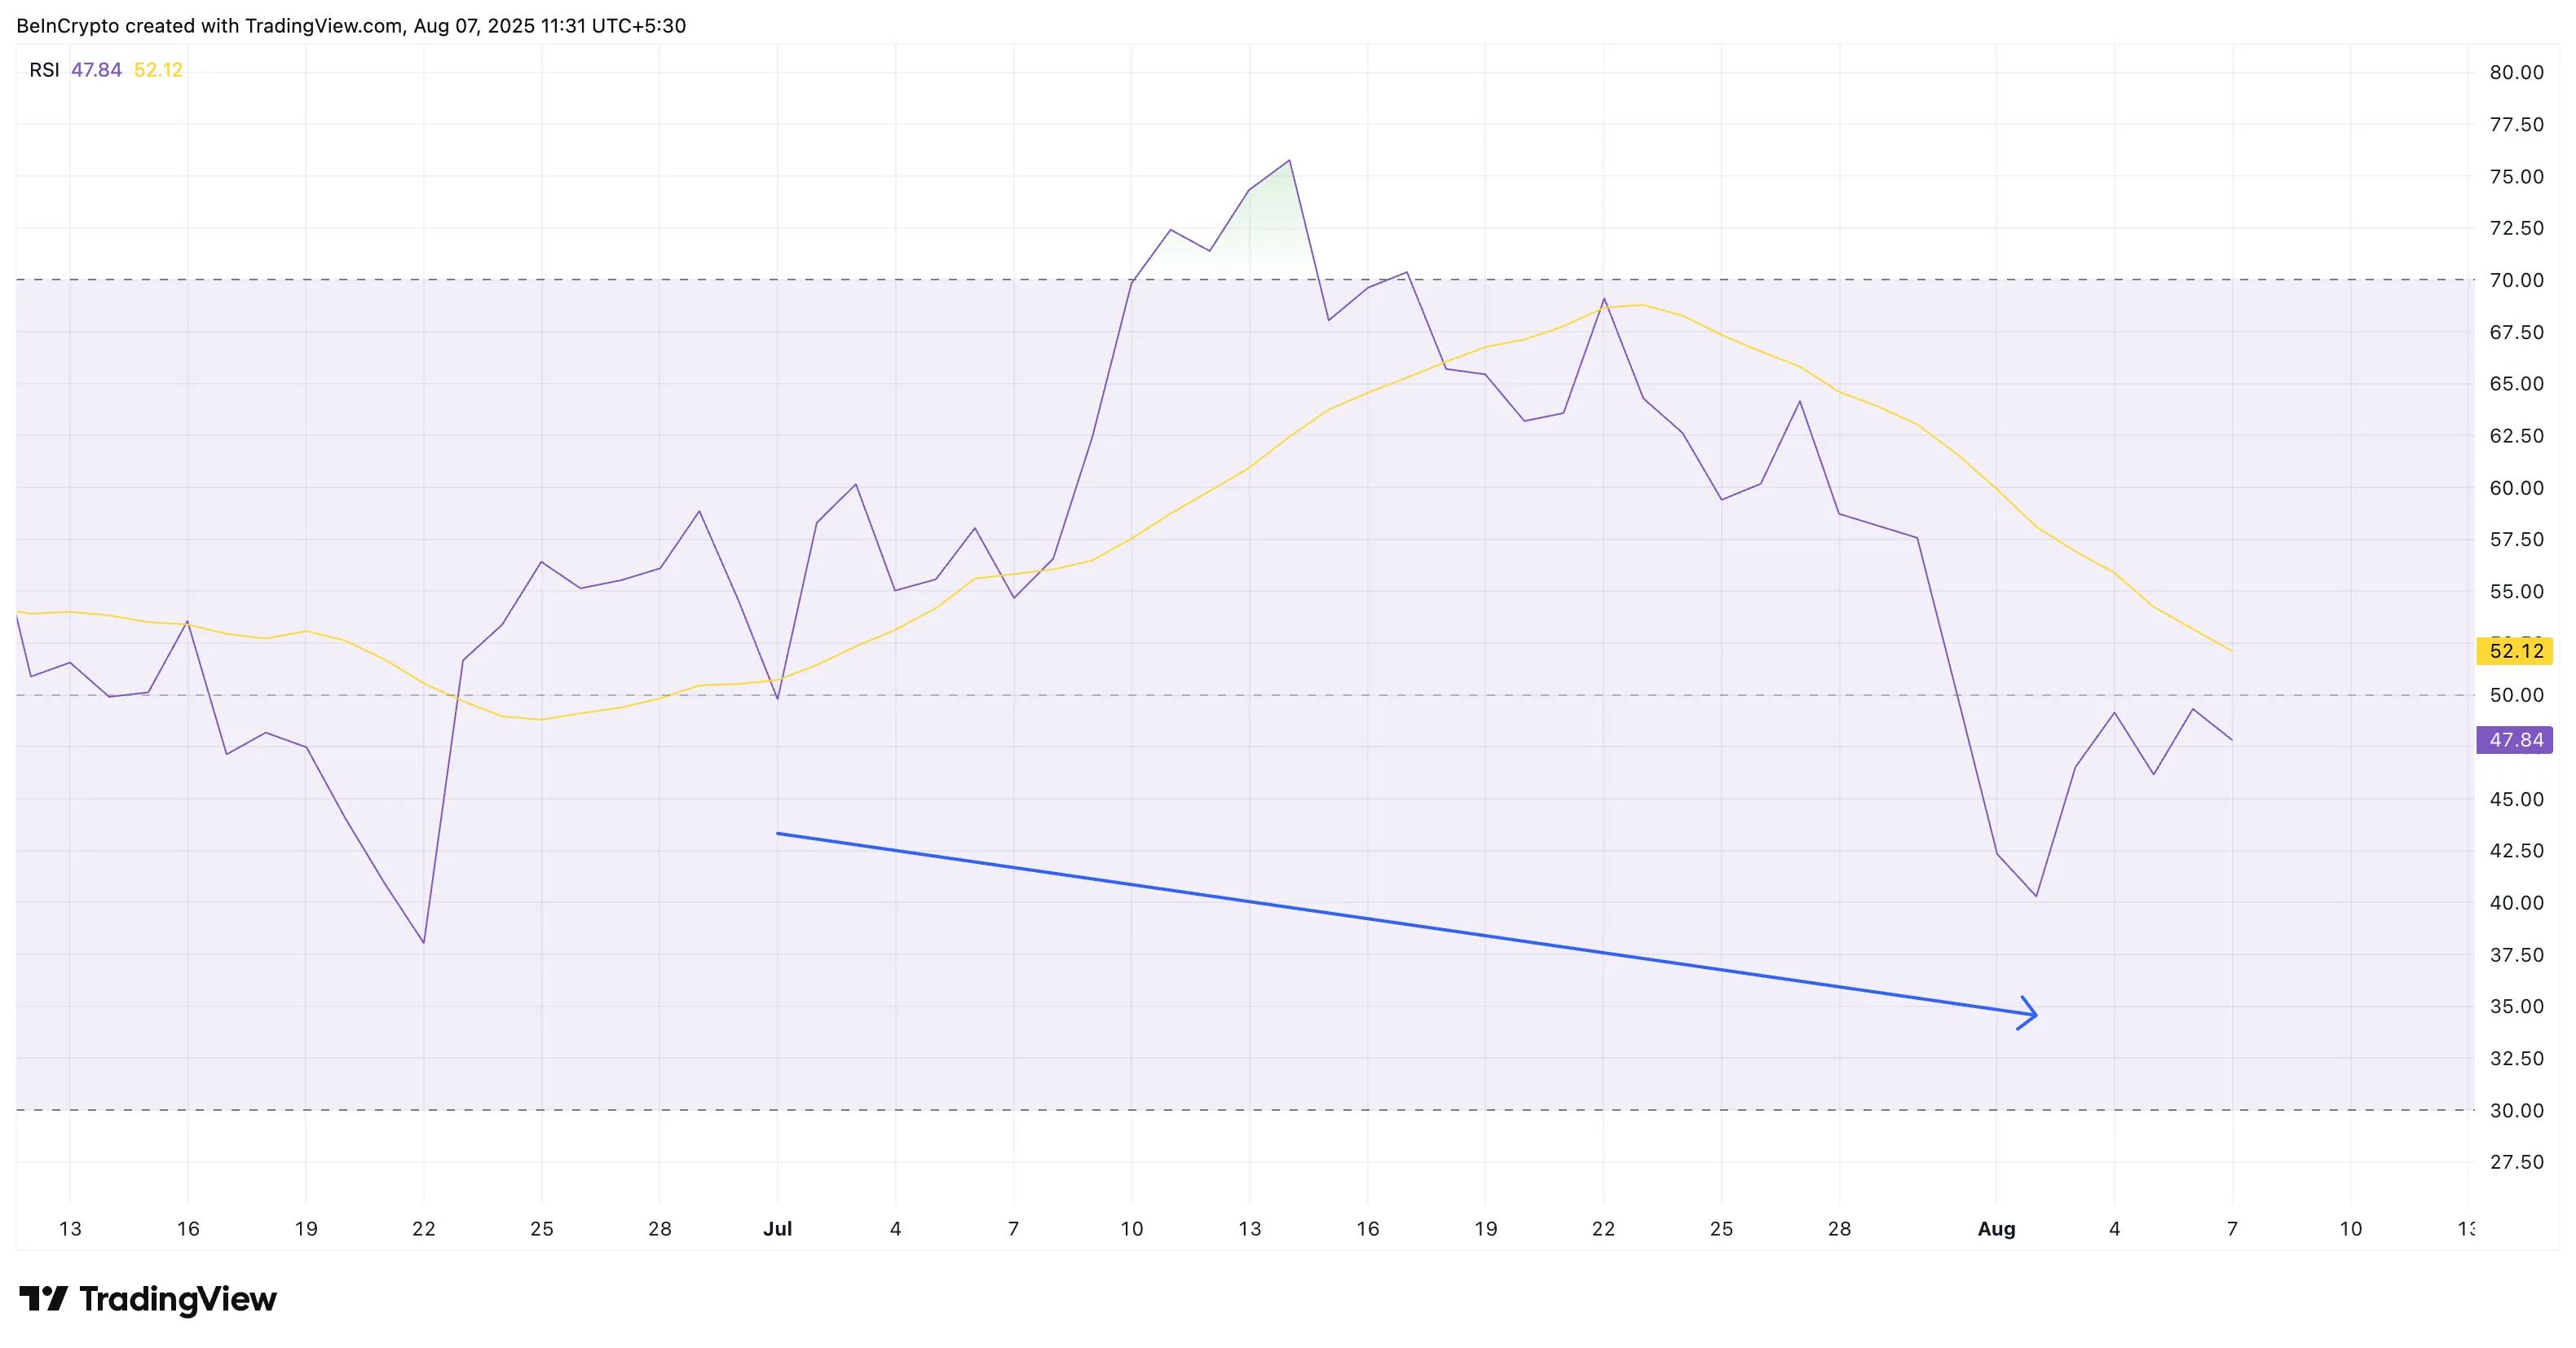
Between July 2 and August 2, Bitcoin formed a higher low, indicating that each subsequent dip was not as deep as the one before it —a classic sign of strength in price. However, during the same period, the RSI hit a lower low. This is known as a hidden bullish divergence, indicating that momentum is building quietly, even if the price has not yet risen significantly.
The Relative Strength Index (RSI) measures the strength of recent price moves to spot potential trend shifts.
So, while the price chart appears stuck, the RSI is quietly indicating that buyers are still in control, and that any breakout could have strong legs. This also indicates that the underlying trend remains bullish.
Now pair this with the actual chart pattern. Bitcoin is moving inside a bullish pennant pattern. The key resistance remains $115,000. That’s the line Bitcoin just can’t break. But price has been making higher lows while consolidating under that level.
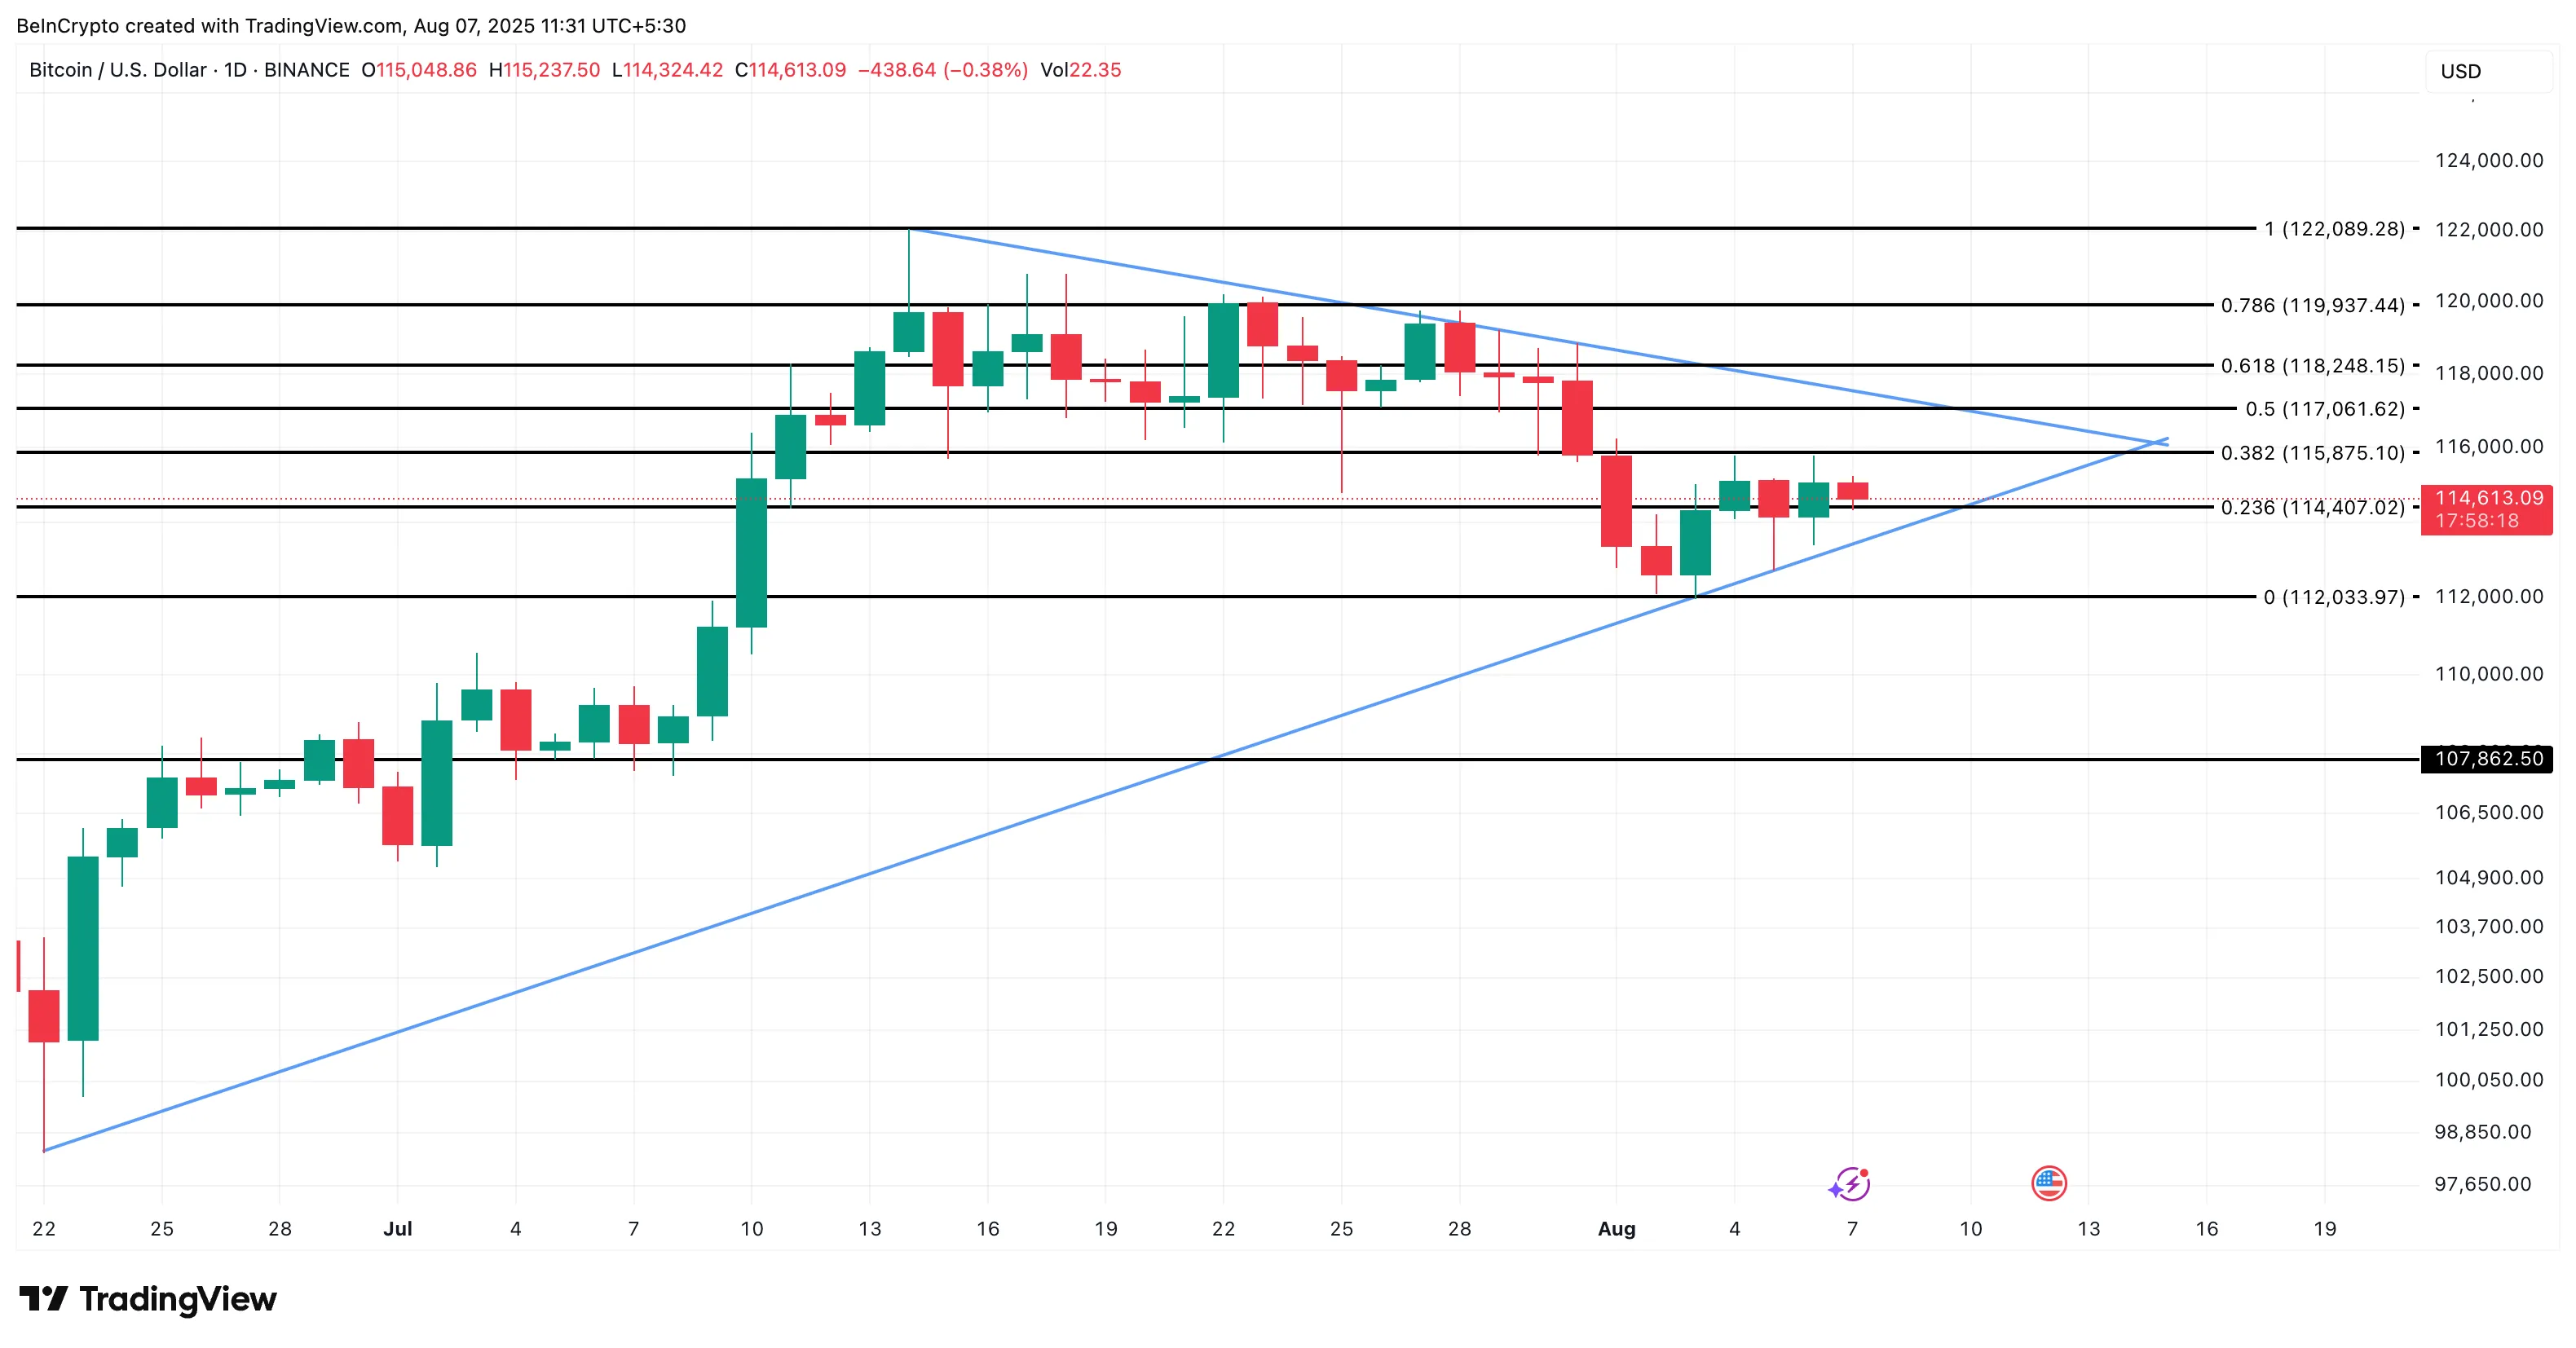
If Bitcoin can close above $117,000 and then $118,000, the breakout may confirm. Invalidation lies below $114,000 and especially under $112,000. A breakdown there could drag BTC to $107,000, but right now, all signs point to short-term strength building up.
Disclaimer
In line with the Trust Project guidelines, this price analysis article is for informational purposes only and should not be considered financial or investment advice. BeInCrypto is committed to accurate, unbiased reporting, but market conditions are subject to change without notice. Always conduct your own research and consult with a professional before making any financial decisions. Please note that our Terms and Conditions, Privacy Policy, and Disclaimers have been updated.