

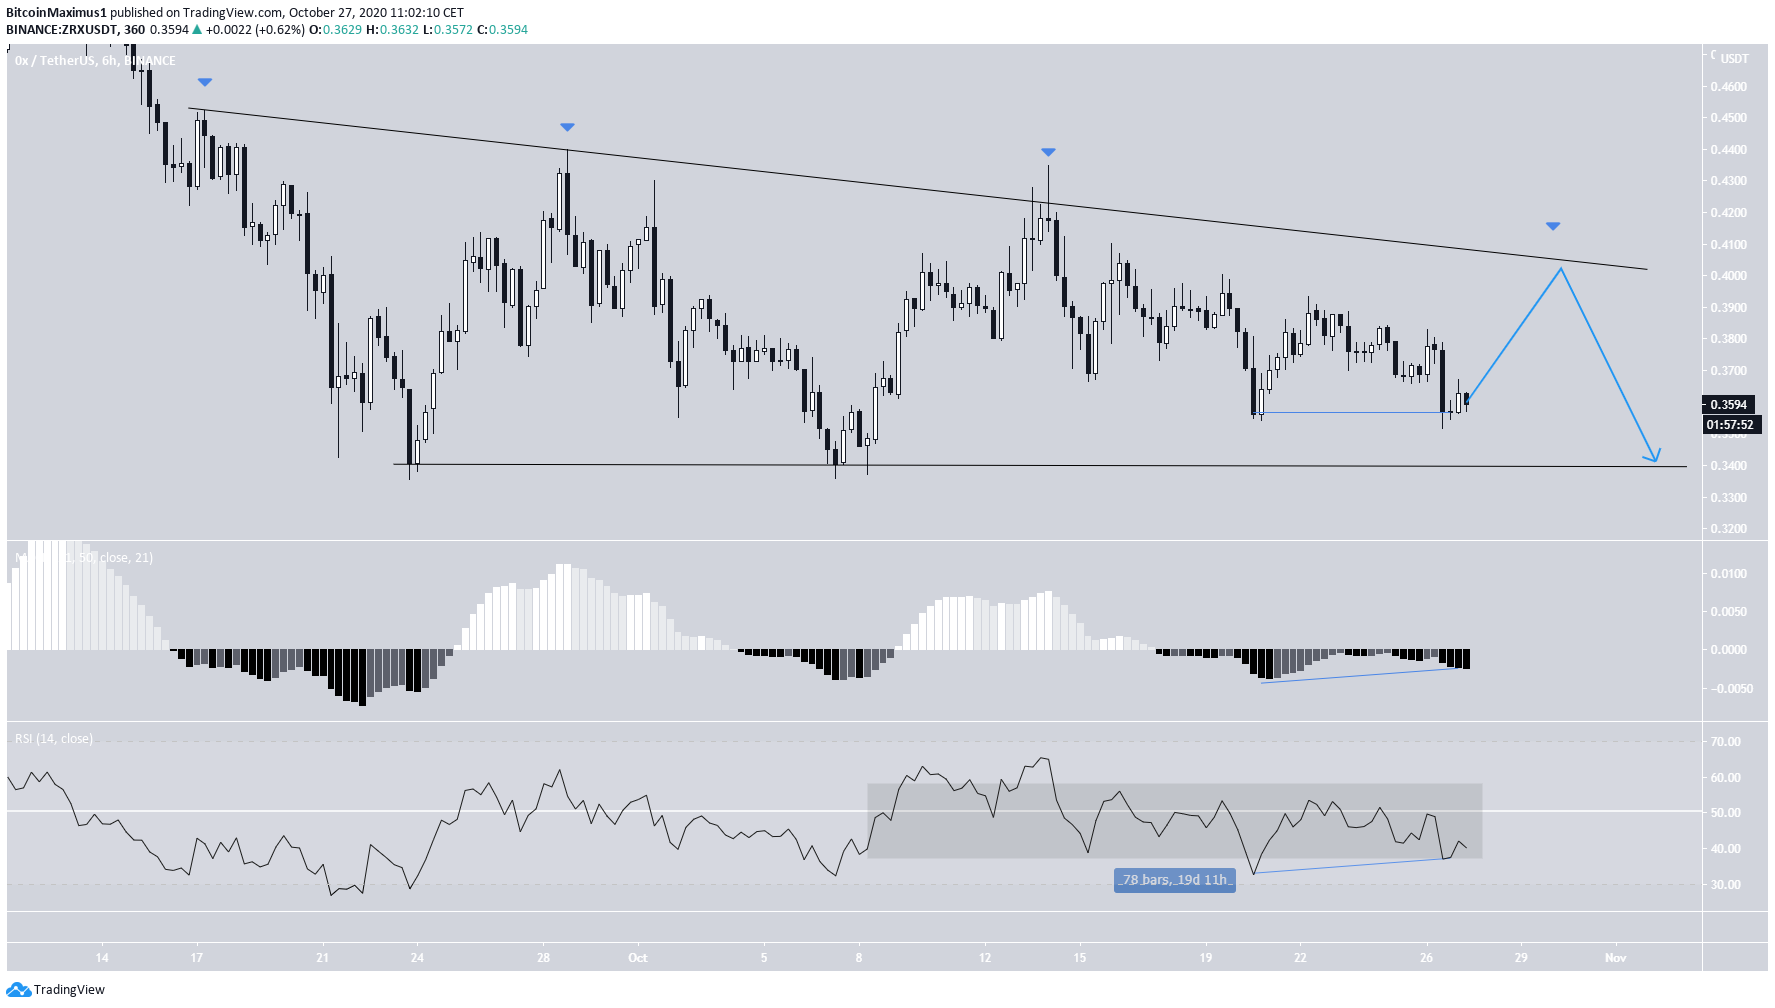
The 0x (ZRX) price has been decreasing since Aug 21 and is approaching two crucial support levels.
Unless the price manages to break out from the current pattern, ZRX is expected to drop back in order to re-test these supports.
ZRX Searches for Support
ZRX has been decreasing since Aug 21, when the price reached a high of $0.96. Since that time, ZRX has lost around 63% of its value. Its local low was reached on Sept 23 when it hit $0.335. The price is approaching a significant support area at $0.293, which is the 0.786 Fib level of the entire downward move. If this support fails, the next support level would likely be found near $0.21. Conversely, the closest resistance area is found at $0.43. This is a level that has rejected the ZRX twice since the aforementioned Sept 23 low.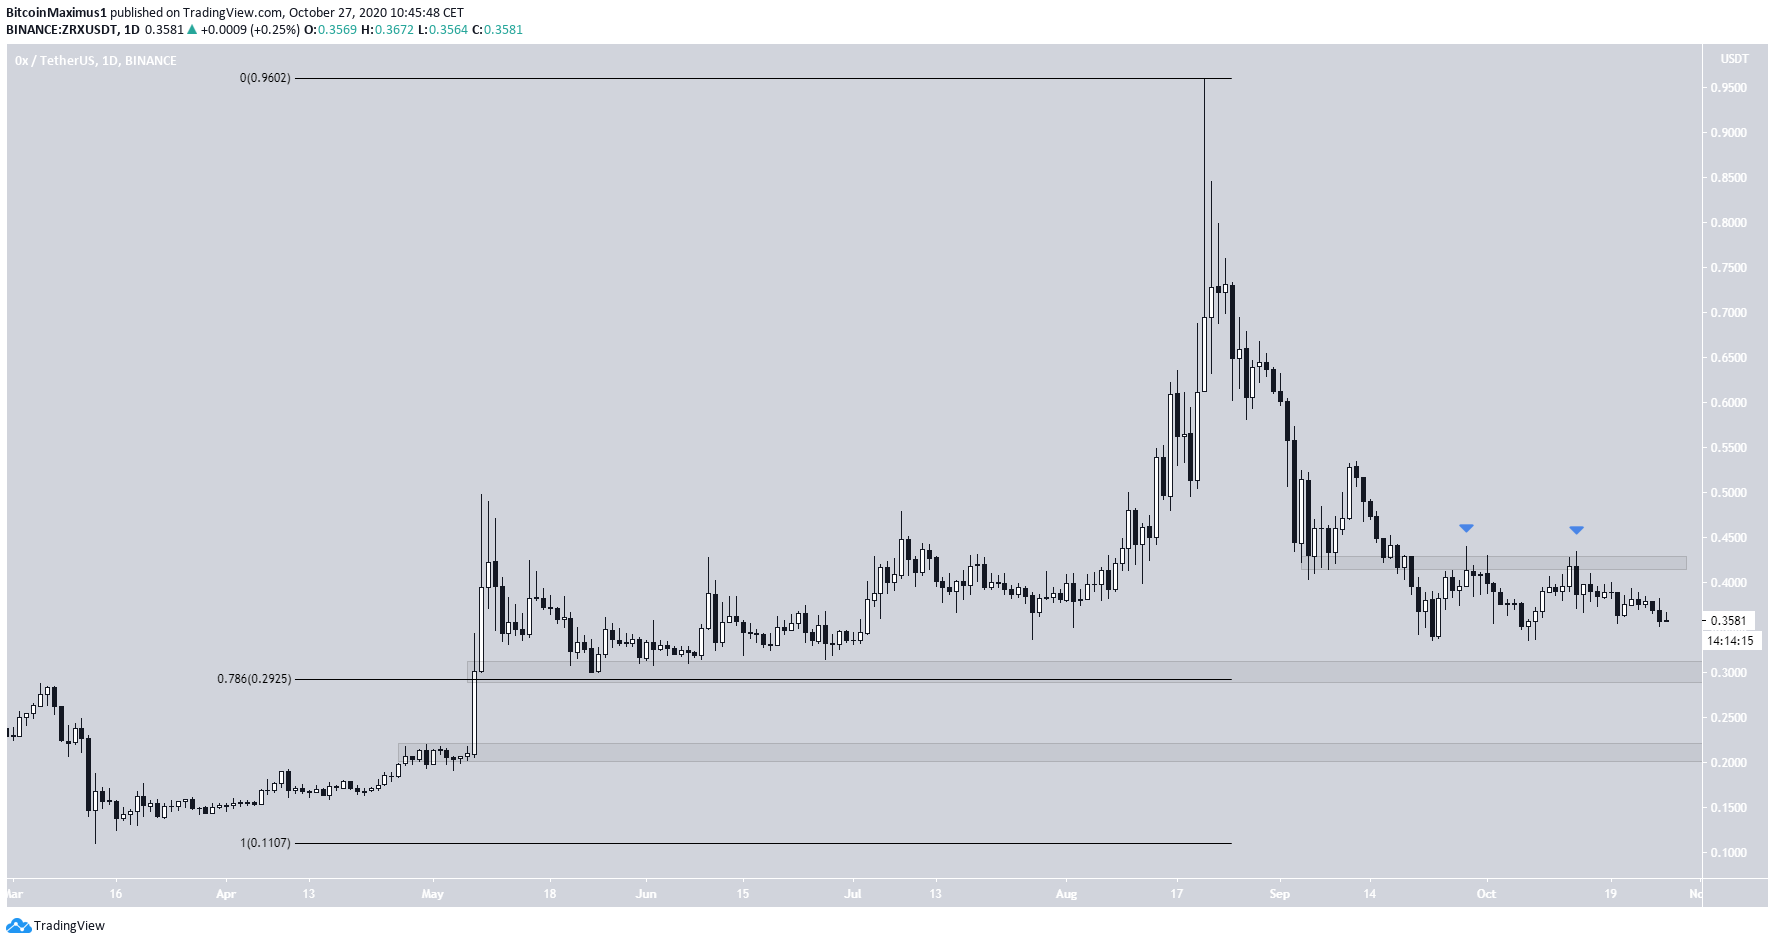
Examining the Trend
Technical indicators in the daily time-frame are leaning on being bearish. While the MACD is positive, it has been steadily decreasing over the past week. The RSI has been rejected by the 50-line and is beginning to drop, while the Stochastic oscillator is in the process of making a bearish cross (shown with the red circle below). This suggests that a decrease towards the support area at $0.273 could occur.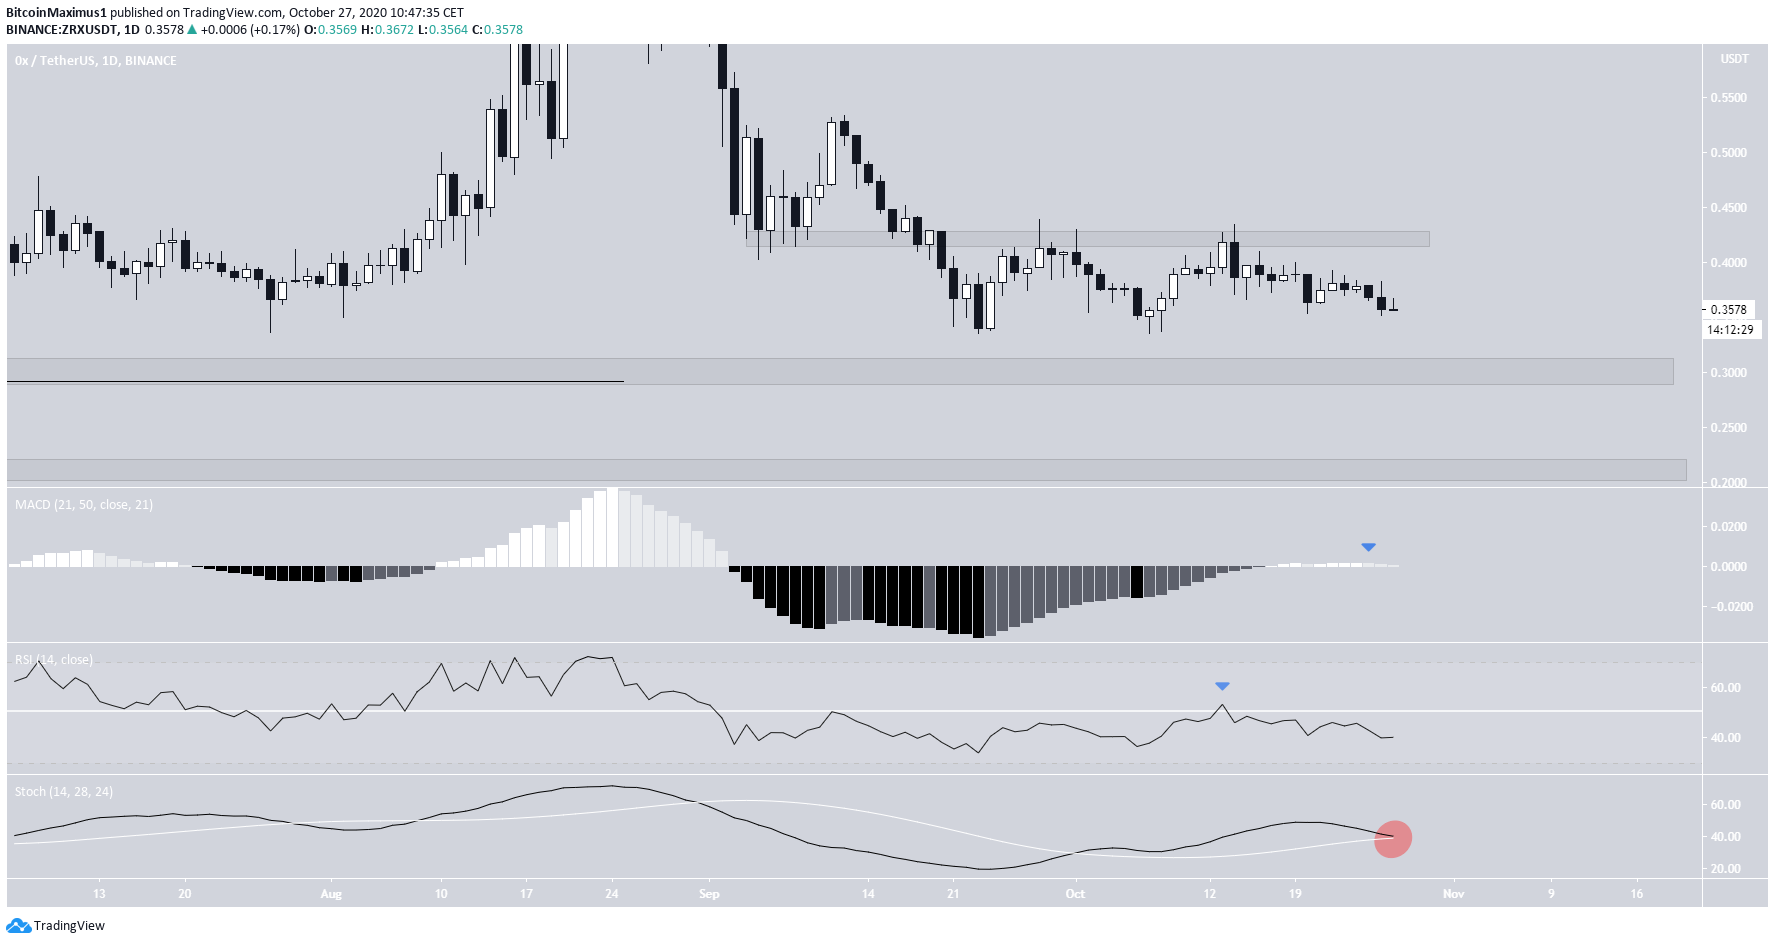
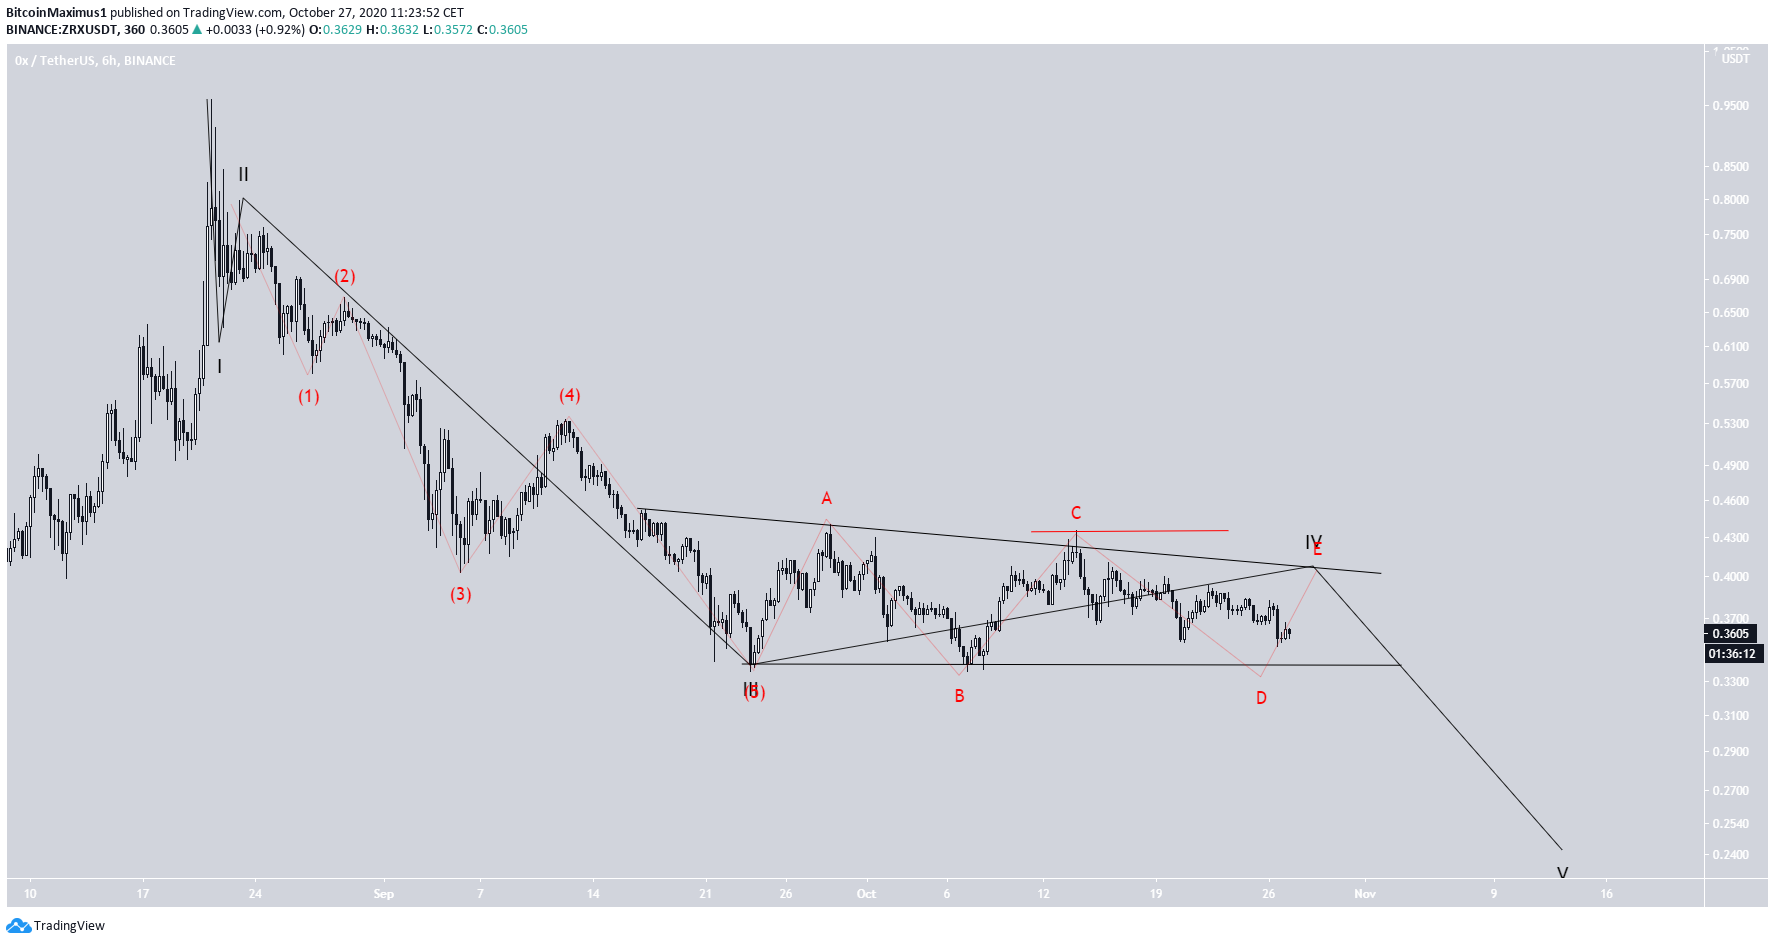
Wave Count
Cryptocurrency trader @Mesawine1 outlined a ZRX chart which suggests that the price is in a B wave, which is expected to take the price towards $0.50, before a final decrease drop back to $0.23. The latter level would coincide with the previously outlined support area.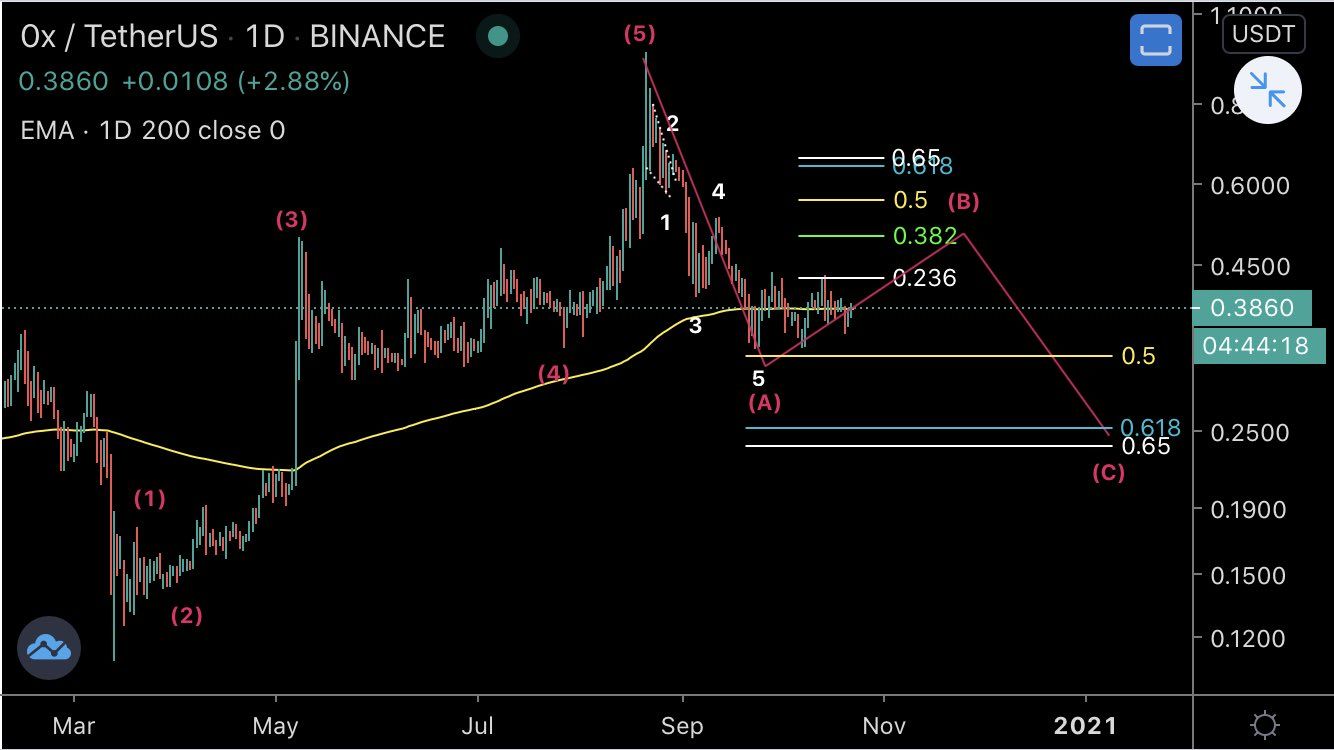
Disclaimer
In line with the Trust Project guidelines, this price analysis article is for informational purposes only and should not be considered financial or investment advice. BeInCrypto is committed to accurate, unbiased reporting, but market conditions are subject to change without notice. Always conduct your own research and consult with a professional before making any financial decisions. Please note that our Terms and Conditions, Privacy Policy, and Disclaimers have been updated.

Valdrin Tahiri
Valdrin discovered cryptocurrencies while he was getting his MSc in Financial Markets from the Barcelona School of Economics. Shortly after graduating, he began writing for several different cryptocurrency related websites as a freelancer before eventually taking on the role of BeInCrypto's Senior Analyst.
(I do not have a discord and will not contact you first there. Beware of scammers)
READ FULL BIO
Sponsored
Sponsored